Report Snapshot
Situation
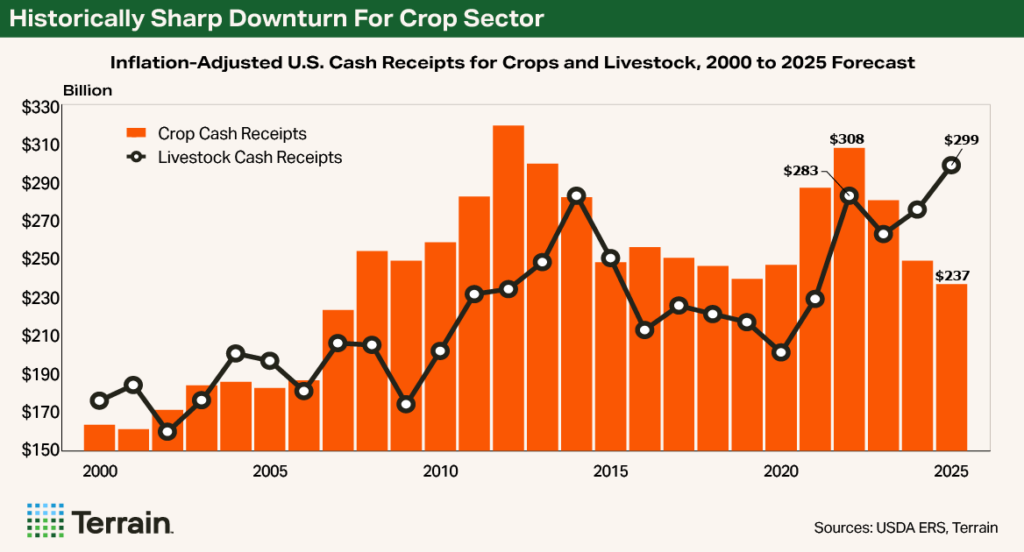
Crop producers are facing the largest-ever three-year decline in crop revenue.
Finding
USDA does not differentiate indicators of farm financial performance by agricultural sector. Strong working capital positions from the cattle sector are masking the depletion of working capital positions in the crop sector.
Outlook
The administration and Congress have taken actions to shore up the farm economy, but it will take time for these actions to improve the bottom line for farms and ranches.
Impact
Given current challenges in the farm economy, farmers must tightly manage cash flow, maintain operational discipline, and work with risk management partners and lenders to navigate the downturn.
On the surface, U.S. net farm income appears robust. The USDA’s projection for U.S. net farm income sits at $180 billion, the second-highest ever in nominal terms and the fifth-highest of all time when adjusted for inflation.
But, beneath the surface, things are not as they appear. When excluding nearly $41 billion in federal support to agriculture in 2025, the U.S. farm economy is in the third year of an economic downturn—down $42 billion, or 23%, from 2022’s inflation-adjusted value (also excluding federal support).
Now we know that farmers, uncertain about future soybean demand, likely planted more than 98 million acres of corn. Due to favorable weather, a record 16.8 billion-bushel corn crop is supposedly on the horizon. We also know that as of early September, China has remained on the sidelines of the new crop soybean market—leading USDA to forecast exports to China in fiscal year 2026 at only $9 billion, the lowest total in nearly two decades. Both developments have combined to roil prices for the two largest crops in the U.S., both now near pre-pandemic price levels.
A Tale of Two Farm Economies
Across the livestock sector, dairy margins have remained favorable, prices for feeder and fed cattle have reached record highs (also benefiting dairy farmers who are breeding to beef), and farrow-to-finish hog margins have been profitable—reaching their highest levels since 2022.
To little surprise, in USDA’s most recent September farm income forecast the Department raised its projection for livestock cash receipts to a record $299 billion and $23 billion higher than the February estimate. For crops, the Department projected crop cash receipts at $237 billion, down $3 billion from the February estimate, but importantly, in inflation-adjusted terms down $71 billion from three years ago – matching the history books for the largest-ever three-year decline in crop revenue.
Observation
Matching the largest three-year decline in crop cash receipts in history, the downturn in today’s farm economy is driven by rapidly declining crop farm profitability associated with lower prices and elevated input costs. Diversified crop-livestock operations and livestock-only operations are likely operating in a more favorable economic environment.

Farming is More Expensive Than Ever
While USDA confirmed the challenges facing the crop sector and their implications on the broader farm economy, USDA also confirmed another well-known fact across rural America: input costs have soared to a record high and they remain stubbornly sticky.
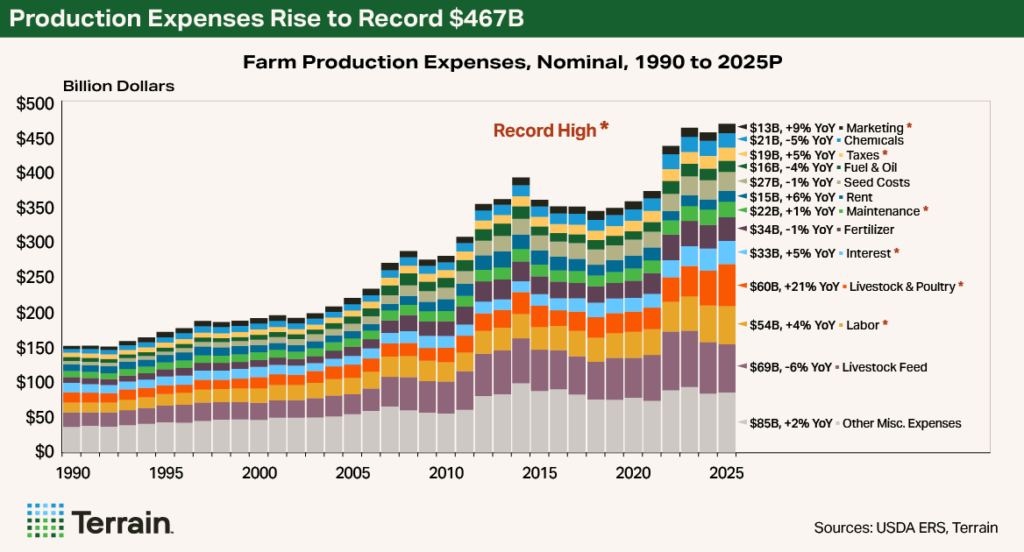
For 2025, USDA now projects total production expenses to reach a nominal record of $467 billion, up 31% or more than $110 billion from the pre-inflationary environment of 2020. Among the major input cost categories, several are at record-high levels, including replacement livestock and poultry animals at $60 billion, labor expenses at $54 billion, interest expenses at $33 billion, maintenance and repairs at $22 billion, taxes at $19 billion and marketing and storage fees at $13 billion.
These elevated and sticky input costs make the prospects of breakeven elusive for crop producers even with record-high yields. For example, the Department’s Economic Research Service forecasts cost-of-production for corn and soybeans in 2025 at $897 per acre and $639 per acre, the second-highest and highest all time, respectively. Using USDA’s September yield projections for corn and soybeans of 186.7 and 53.5 bushels per acre the all-in breakeven price would be $4.81 for corn and $11.95 for soybeans – well above the currently projected season average prices of $3.90 and $10.10 per bushel.
If we were in a pre-inflationary environment where total costs of production were $678 per acre for corn and $492 per acre for soybeans, today’s record yields would translate into breakevens of $3.63 per bushel and $9.19 per bushel for corn and soybeans, below the current season average price projections. The same can be said for wheat, cotton, milo, rice, and peanuts among other crops.
Observation
Record-high input costs that are showing no signs of near-term retreat are resulting in crop margins that have been at or below breakeven for several consecutive years. Working capital is being eroded from the Corn Belt, down into the Delta and east into the Cotton Belt. One factor, outside of marketing and risk management, that factors heavily on production costs and is differentiating profitability on crop farms across the U.S. is the degree to which farmers own or rent their cropland.

The Farm Economy Fallacy
These stresses in the U.S. farm economy are not immediately clear when evaluating aggregate farm economic indicators. Working capital on farms, which measures the available cash for day-to-day business operations, is now projected by USDA at $168 billion—the highest level in nominal terms since the data was first recorded in 2009. The ratio of working capital to gross revenue, at 26%, is the highest in over a decade. Nothing to see here, right?
The challenge is USDA does not differentiate working capital estimates by agricultural sector. Strong working capital positions from the cattle sector are masking the depletion of working capital positions in the crop sector—making balance sheets overall appear stronger than they may be for some.
Similarly, the debt-to-asset ratio stands at 13.4%, well below levels exceeding 20% in the 1980s. It’s the same for the debt-to-equity ratio, which reads at 15.5% today, half of what it was approximately 40 years ago. The rate of return on farm assets today is estimated at more than 8%, three times as high as the average rate of return during the last downturn in the farm economy. Delinquency rates remain low and Chapter 12 farm bankruptcies, measuring 282 filings in the 12 months ending in June 2025, are higher than year-ago levels, but they are 56% lower than the most recent peak in 2020.
Observation
With inflation-adjusted farm debt at a record $592 billion, overly vague farm financial ratios that do not differentiate by farm type or size mute the underlying risks to agricultural credit conditions. We cannot fully see the economic conditions of a marginal farmer or a sector in distress.
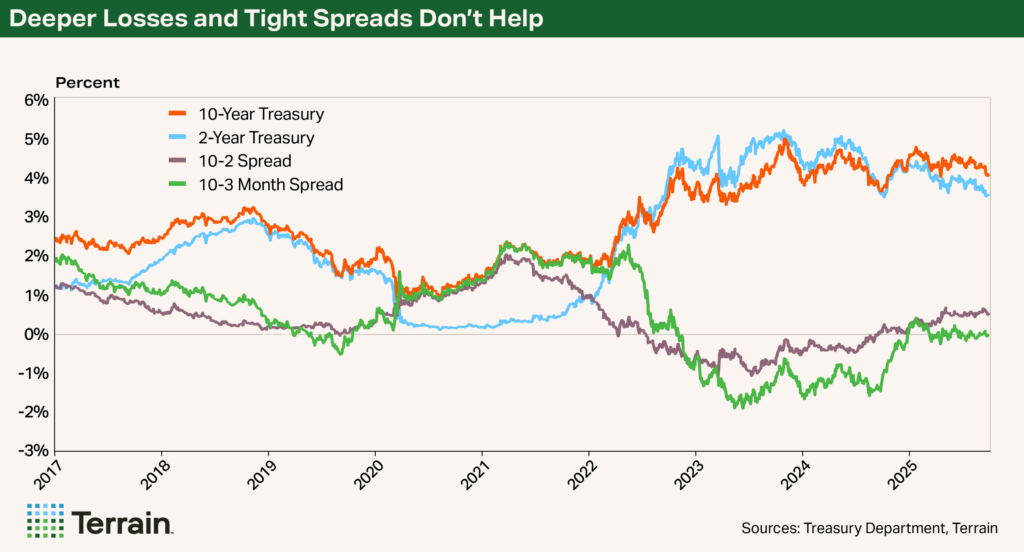
The interest rate environment is also different than it was during the last downturn in the farm economy. In today’s interest rate environment, rates are more expensive, and the losses are potentially much deeper. As a result, there is less flexibility for lenders on payment terms, and odds are better than not that any efforts to assist distressed borrowers may not ultimately lower their cost structure.

Help is Coming—But It Will Take Time
Congress has responded to the multi-year downturn in the crop farm economy. The American Relief Act of 2025 provided USDA with nearly $31 billion to deliver ad hoc financial assistance to crop and livestock farmers experiencing economic and natural disasters. Combined across USDA’s Emergency Commodity Assistance Program, the Supplemental Disaster Assistance Program and the Emergency Livestock Relief Program, nearly $14 billion has been distributed to crop and livestock producers this year, as of early September.
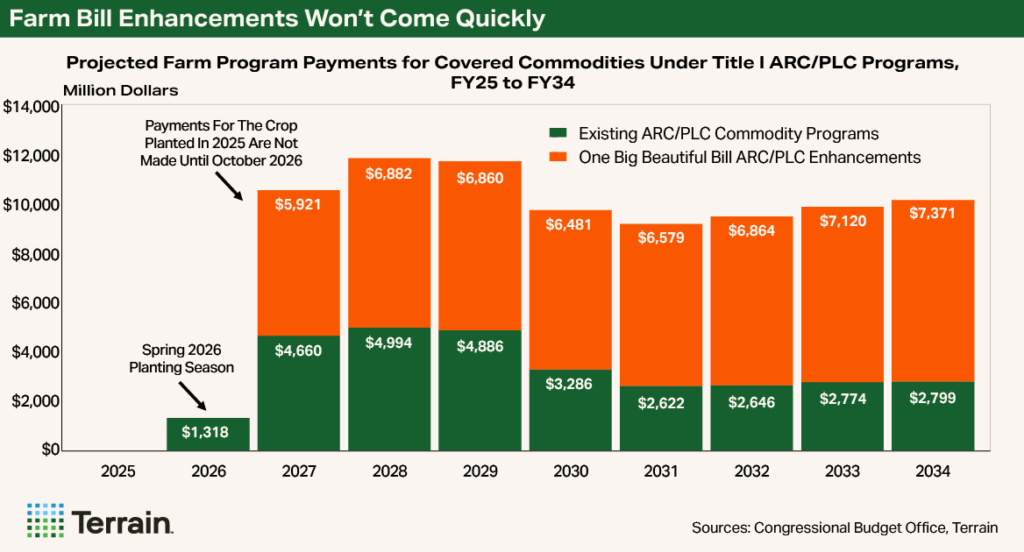
Following the American Relief Act, Congress made a historic $66 billion investment in farm bill risk management programs, conservation programs and trade promotion programs in the One Big Beautiful Bill Act. For farmers with eligible commodities and acres, the enhanced farm bill support is projected to result in more than $53 billion in additional commodity program payments from fiscal year 2027 to 2034. The enhancements to crop insurance will be effective with the 2026 growing season and will provide greater area-based coverage as well as much more affordable premium rates due to a higher federal cost share.
Observation
Congress has taken action to shore up the farm economy, but many lenders do not include federal support or crop insurance indemnities on the balance sheet until they are certain. Farm program payments remain uncertain as the new crop marketing year is just underway and crop insurance coverage for the 2026 crop year won’t be solidified until this fall or next spring. Thus, while we know additional financial support is on the way for the farm economy, the enhancements made in the One Big Beautiful Bill Act will take time to materialize into the bottom lines of farmers and ranchers.

More Than a Midwest and Deep South Problem
Much of the narrative on the health of the U.S. farm economy has focused on the multi-year economic downturn facing the crop sector. But other challenges remain.
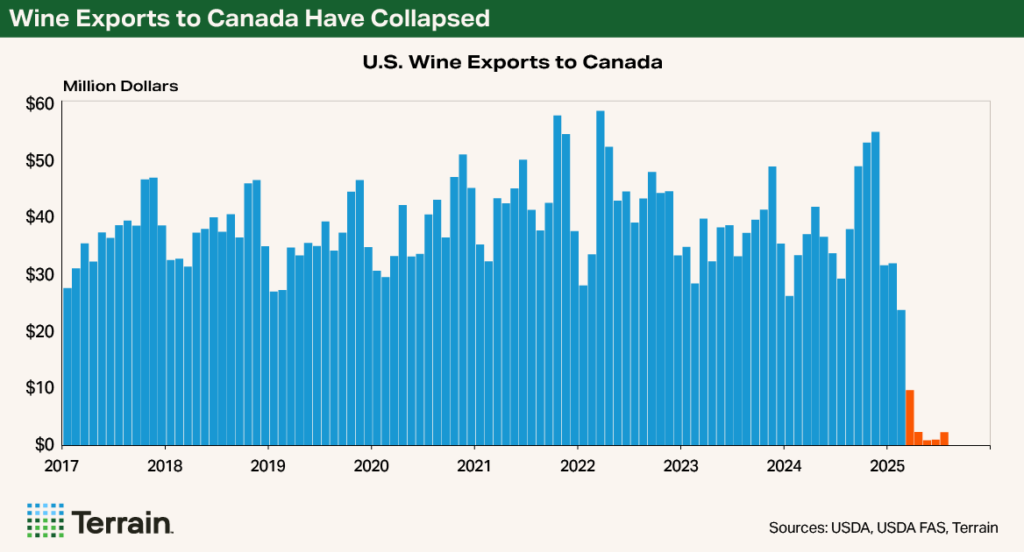
For example, Canada has long been the largest buyer of U.S. wine internationally, representing 35% of U.S. wine exports by value and nearly $500 billion in annual revenue each year for U.S. producers. Once Canada instituted a 25% retaliatory tariff on American wine and Canadian provinces banned American wines from store shelves, wine exports to Canada collapsed – down more than 96% year-over-year in the second quarter of 2025 alone, representing a loss of more than $100 million in revenue. This decline in wine exports subsequently reduces demand for U.S. grapes and comes amid an already challenging period for grape growers due to depressed consumer demand in the U.S. and an oversupply of grapes.

As another example, tree nut producers in California’s Central Valley continue to face financial strain following record-high pandemic-era inventory that drove prices down and eroded working capital across many operations, prompting widespread acreage removal. With roughly 60% to 70% of tree nut production exported, trade frictions have reduced demand and fueled uncertainty, though their full impact has yet to be determined.
As in other sectors of agriculture, rising input costs have kept profit margins compressed. In addition to lower income levels, groundwater regulations have accelerated land value depreciation, particularly in water-scarce regions. In some areas, and as recently as 2024, orchard values had already experienced a decline in value by as much as 30% year-over-year. Trade uncertainty has done little to support orchard values and incomes for tree nut producers given their compounding economic challenges.
Observation
The economic challenges facing U.S. agriculture are much more than a row crop, Midwest or Deep South issue. Tree nut producers are facing uncertainty in trade and increasing regulatory burdens, the wine industry and grape growers are confronting declining alcohol consumption and trade headwinds, and livestock producers remain on high alert for ongoing animal disease pressures. All of these pressures weigh on the farm economy.
There’s no question that there are farmers across the U.S. under increasing financial pressure. Turning the corner will take time, but the turn signal is on. Congressional actions to boost farm risk management tools, the announcements of new and upcoming trade deals that enhance or increase market access, reduced regulatory burdens, increased efforts to prepare for and respond to animal disease outbreaks, certainty on tax provisions impacting family farms and an increased emphasis on domestic biofuel production and utilization will help U.S. farmers and ranchers turn the corner on these economic challenges.
For farmers operating under challenging economic circumstances (and as my colleagues Matt Clark and Matt Erickson recently reported) it is essential to effectively manage cash flow, uphold operational discipline, seek partnerships that enhance efficiency or reduce costs, conduct detailed planning for expansion and capital investments, and collaborate with lenders and risk management professionals to address the ongoing downturn in the agricultural economy.
Terrain content is an exclusive offering of AgCountry Farm Credit Services,
American AgCredit, Farm Credit Services of America and Frontier Farm Credit.
