Outlook • October 27, 2025
Farmland’s Value Drift
The Rural Economist: Fall 2025


Report Snapshot
Situation
Farmland values in some parts of the U.S. have begun to show signs of stress, though values in some regions remain steady.
Finding
Investors should be aware that some held farmland assets may need to be marked down slightly, whereas others remain stable or are still increasing in value.
Outlook
There will likely be more opportunities to enter the market that require careful asset valuation.
Farmland has long served as the spine of agricultural finance, both as the primary investment vehicle and the primary collateral. Historically, farmland has been in high demand, held its value relatively well, and mostly generated profitable annual returns. However, as much of the farm economy continues to struggle through poor commodity prices, high input costs, and thin to negative profit margins, farmland values have come under some pressure.
In this issue of “The Rural Economist,” Terrain focuses on farmland values in the Midwest and out West. Our analysis finds that:
- Cropland values in the Midwest have softened following several years of strong growth
- Ranchland values continue to increase alongside record cattle incomes
- Orchard values for tree nuts in the Central Valley continue to struggle
- Farmland values in the coastal regions of California remain resilient
- Vineyard values in the North Coast of California have declined sharply
The diverse geographies and uses represented in the current farmland market could provide future investment opportunities. Still, caution is warranted, as the dynamics in the current market vary widely.
Midwest Cropland Values Moderate
By Matt Clark
Cropland values in the Midwest have begun to soften after a prolonged period of strong growth. Data collected from the Federal Reserve Banks of Chicago, Kansas City and Minneapolis all indicate a brief decline starting in late 2024 and into 2025, breaking a streak of about five years of consecutive growth for each region.
However, the decline in cropland values has been very modest. For example, the Minneapolis Fed recorded a 0.1% year-over-year (YOY) decline in the second quarter of 2025. The Chicago Fed recorded a 1% decline in the fourth quarter of 2024, but prices have rebounded slightly in 2025. Additionally, the Kansas City Fed recorded a 2% drop in the first quarter of 2025 and a 1.5% decline in the second.
Breaking down the regions further, research from Farm Credit Services of America indicates that in June, cropland values declined by 3.6% YOY in Iowa and 1.2% in Nebraska, while cropland values in Wyoming remained stable and increased 6.2% in South Dakota. Farmland values, which may include some pasture ground, declined 2.5% in Minnesota, held flat in North Dakota, and increased 4.8% in Kansas and 3.1% in Wisconsin.

The mix of declining and strengthening cropland values in these states helps confirm the regional data from the Federal Reserve Banks showing a general softening in cropland values, with some regions still experiencing rising values.
The recent softness in cropland values is also consistent with the decline in crop profit margins. The USDA calculates net profit margins for 2025 to be -$161/ac. for corn, -$98/ac. for soybeans, -$117/ac. for wheat and -$189/ac. for sorghum. On an acre-weighted basis, net profit margins for these four crops were -$113/ac. in 2024, versus a projected -$130/ac. in 2025, excluding government assistance or crop insurance indemnities. Additionally, total gross cash income from these crops has declined three years in a row and is down nearly 35% from 2022 to 2025, adjusted for inflation.
The recent cycle in cropland values, beginning around the first quarter of 2020, has been strong, even allowing for the recent softness.
The decline in receipts from crop commodities will be partially offset by large government payments in 2025 (associated with losses from 2022 to 2024) — forecast to increase $30.16 billion from 2024 — and strong livestock margins for diversified operations. Still, the general decline in farm liquidity from poor crop returns has contributed to softer cropland values in some states.
From a broader perspective, the recent cycle in cropland values, beginning around the first quarter of 2020, has been strong, even allowing for the recent softness. For example, the compounded annual growth rate from the first quarter of 2020 through today is around 9% for each Federal Reserve District. The current cycle compares very favorably to historical land value cycles, although it is less robust than the strong 2010 to 2015 cycle.
From the perspective of a decade, the start of the 2020s has been historically strong. Current softness in cropland values could cut into future gains much like the back half of the 2010s, which followed a similar pattern.

Bottom line: After years of steady growth, Midwest cropland values are showing modest signs of softening, driven by declining crop profit margins and an expectation of reduced farm liquidity. However, regional variations and strong historical gains suggest the market remains resilient overall. Investors should carefully consider market valuations for new opportunities and keep in mind that crop profit margins remain tight, so income generation is likely to be subdued in the near term.
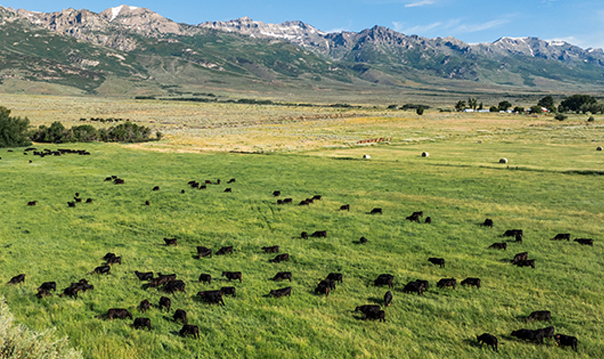
Ranchland Values Get a Second Date
By Matt Clark
Ranchland values have enjoyed a lengthy period of solid growth, increasing for seven consecutive years in the Kansas City Fed District and five years in the Minneapolis Fed District.
Much of the increase in ranchland values can be attributed to healthy cattle cash receipts. Gross cattle receipts have increased for five consecutive years on an inflation-adjusted basis. Additionally, cattle receipts in 2025 are expected to surpass the combined receipts of corn, oilseeds (soybeans), wheat and other feed crops for the first time since 2001. Appraisers and other real estate connections also note that the combination of the pandemic and “the ‘Yellowstone’ effect” has further increased demand for ranching lifestyle homes, which has historically been robust.

The result of increased demand has been strengthening ranchland values. Since the start of the decade, ranchland values are up 10% in the Kansas City Fed District, 7% in the Minneapolis Fed District, and 12% in the Dallas Fed District on a compounded annual growth basis. For the Kansas City and Dallas districts, ranchland value gains have actually outpaced cropland gains since 2020, a sharp turn from the previous decade.

At a state level, recent gains in ranchland have been significant. For example, Farm Credit Services of America reports that in June, ranchland values increased 26.2% in South Dakota and 9.9% in Wyoming from the previous year. Ranchland values in Nebraska were flat from the previous year.
Bottom line: Strong cattle receipts and a desire for rural lifestyles have combined to boost ranchland values, in some cases at a stronger rate than cropland in recent years. Ranchland typically carries much lower annual returns (rent) than cropland, but the recent gains in ranchland values are notable.
Central Valley Tree Farmland and Coastal Berry Farmland Moving in Opposite Directions
By Matt Woolf, Ph.D.
According to USDA data, California’s average farmland value increased 2.2% from 2024 to 2025. Yet the aggregate number misses the state’s diversity of crops and the fact that land values are stable to increasing in some regions while they’re in sharp decline in others. These disparities stem from drops in commodity prices and the localized effects of the Sustainable Groundwater Management Act (SGMA). Going through some of the state’s primary farming regions helps paint a clearer picture of what’s actually happening on the ground.
The most important place to start is the Central Valley, where land values have depreciated by as much as 30%. These drops have raised concern among everyone in the industry, from farmers to investors.
Some of the value declines can be attributed to low commodity prices, which have suppressed almond and walnut profitability for years. When the pandemic hit, the almond and walnut industries were left with large inventories that couldn’t get exported, leaving handlers with large piles of product. Cropland values have also softened, however, as farmers struggle with which annual crops they can get reliably contracted for a profit.
Although prices for numerous crops have shown recent improvement, there remains an elephant in the room influencing values that operates independently from the fluctuations of commodity markets. SGMA is a law that enforces levels of groundwater use in stressed aquifers across the state and could end up fallowing as much as 500,000 to 1 million acres in the region, according to the Public Policy Institute of California.
Local regions submitted “groundwater sustainability plans” in 2020 or 2022, which typically include measures to add supply and reduce demand. In some regions this has meant quotas on how many acre feet of water can be pumped out of the ground.
Because SGMA’s implementation coincided with record-low profitability in the Central Valley, it has been challenging to parse whether land value declines are driven by crop prices or future water availability. Comparing recent land value changes in areas that are otherwise similar, however, is revealing.
In Fresno and Madera counties, for instance, almond orchards on the east side typically sell for $12,000 to $42,000 an acre, whereas those on the west side go for $8,200 to $12,000 an acre. From 2023 to 2024, the east remained stable while the west declined by nearly 15%, according to the American Society of Farm Managers and Rural Appraisers. While there are other factors to consider, the relative drop can be primarily attributed to differences in water availability as SGMA-related changes get underway.
Declines in the Central Valley, however, are not reflective of all of California. Coastal regions like Watsonville and Monterey have largely seen stable to increasing land values. One reason is that margins for the crops grown in these Coastal regions haven’t been compressed like they’ve been in the Central Valley. The Central Valley’s tree nuts are largely exported, while the Coast’s lettuce and strawberries are mainly eaten domestically and cannot be stored, making them less affected by global events or inventory pileups.
Row crop land on the Central Coast is valued at $30,000 to $90,000 per acre.
Also, despite a higher percentage of water supply coming from groundwater, these Coastal regions are not in overdraft to the same degree and their crops tend to be less water-intensive.
Because of the earning potential in good years, relative water stability, and limited supply of land in these regions, row crop land on the Central Coast is valued at $30,000 to $90,000 per acre.
Growers who have managed to maintain stable profits and a strong balance sheet should monitor land values for potential deals, even in a high-interest rate environment.
Land value depreciation poses several risks for farmers. Land is a source of collateral for farming operations, which become critical when commodity prices are low. This is particularly true in California agriculture, where there’s a large upfront cost to produce a high-value crop but less time flexibility than with other commodities on when the crop is sold. Most almond farmers, for instance, rely on their processor to sell their crop and receive a handful of payments throughout the year. A declining balance sheet also makes it much harder to expand or refinance.
Yet risk also brings opportunity, even if it can be hard to spot. Growers who have managed to maintain stable profits and a strong balance sheet should monitor land values for potential deals, even in a high-interest rate environment. Lower values offer a chance to expand or improve an operation’s drought resilience by using water allocations on fallow lands to irrigate planted lands. Having a knowledgeable Farm Credit lender who understands the dynamics of commodity prices and local water is especially valuable today.

Bottom line: Despite a modest statewide increase in farmland values, California’s agricultural land market is deeply fragmented. Commodity price pressures, water access disparities under SGMA, and regional crop dynamics result in sharp declines in areas like the Central Valley and resilience or growth in coastal regions. Some valuations on the books may need to be written down, and new opportunities should be carefully evaluated.
North Coast Vineyard Values Are Falling
By Chris Bitter, Ph.D.
Declining wine sales and excess wine inventory have exerted downward pressure on grape demand and prices in recent years, which ultimately drive vineyard values. This, coupled with an uncertain outlook, has inhibited many potential buyers from entering the market. Active buyers are proceeding patiently and deliberately.
At the same time, a record number of North Coast (Napa, Sonoma, Lake and Mendocino counties) properties are on the market. Sellers have generally been slow to adapt to the changing market environment, and many have held out for prices received when the market was stronger several years ago.
The lack of buyers and disconnect in price expectations have constrained sales activity, making it hard to pinpoint current values. Market dynamics and pricing vary widely depending on the location and attributes of the vineyard. Nonetheless, buyers clearly have the upper hand, and many sellers are now lowering asking prices.
Based on the available evidence, the American AgCredit appraisal team believes that values (excluding lifestyle-oriented properties) have fallen by approximately 10% to 50% relative to the peak throughout much of the North Coast. The exceptions are the prime areas of Napa Valley and the Anderson Valley AVA in Mendocino County, where values are steadier.
Vineyards that have seen the largest reductions, or are not transacting at all, include those that:
- Have older or diseased vines
- Are located in secondary or outlying areas
- Are planted with unpopular varieties
- Lack grape sale contracts
North Coast vineyard values are likely to remain under pressure for some time.
Some vineyards have been purchased with the intent of converting to alternative uses.
Given the uncertain outlook for wine sales and uncertain timetable for recovery in the grape market, North Coast vineyard values are likely to remain under pressure for some time.
Bottom line: North Coast vineyard values have declined significantly — by 10% to 50% in many areas — due to falling wine sales, excess inventory and shifting buyer dynamics. SGMA-related water constraints and varietal preferences further influence market disparities and buyer leverage.
Terrain content is an exclusive offering of AgCountry Farm Credit Services,
American AgCredit, Farm Credit Services of America and Frontier Farm Credit.