Report Snapshot
Situation
A wave of memorandums, state-level regulation, executive orders and statements have driven significant momentum behind transitioning the transportation fleet of medium- and heavy-duty vehicles (MHDVs) to zero-emission vehicles (ZEVs).
Impact
Transportation is a vital piece of the agricultural supply chain, and any changes to the transportation fleet and infrastructure will have an impact on farmers and the food supply chain. For agricultural producers in California, the transition to zero-emission medium- and heavy-duty vehicles (ZE-MHDVs) is likely to cause some initial disruptions in the supply chain. Larger agricultural producers and processors, and smaller producers that contract with large fleets, in California will begin to phase out traditional MHDVs for ZE-MHDVs and develop the needed infrastructure and logistics for timely charging. In addition to initial supply chain disruptions, the upfront financial costs could be very cumbersome for smaller players and create a geographically tighter supply chain.
The Momentum Behind the Movement
The media focus on ZEVs has largely centered on the transition of light-duty vehicles — passenger cars and light trucks — due primarily to California’s Advanced Clean Cars rules, which mandate that by 2035 all light-duty vehicles sold in California must be ZEVs. Thirteen other states and the District of Columbia follow the California Air Resources Board (CARB) standards.1 More recently, though, the electrification of MHDVs has gained significant momentum because of actions both in California and nationwide.
First, CARB adopted the Advanced Clean Trucks (ACT) rule in 2021, with the target “to accelerate a large-scale transition of zero-emission medium- and heavy-duty vehicles from Class 2b to Class 8.”2 ACT requires manufacturers who certify Class 2b-8 chassis or complete vehicles with combustion engines to sell ZE-MHDVs as an increasing percentage of their annual California sales from 2024 to 2035. By 2035, ZE-MHDVs would need to be 55% of Class 2b-3 sales, 75% of Class 4-8 straight truck sales, and 40% of truck tractor sales.2
Additionally, large employers including retailers, manufacturers, brokers and others are required to report information about shipments and shuttle services. Fleet owners with 50 or more trucks must report the composition of their existing fleet operations.2 Massachusetts, New Jersey, New York, Oregon, Vermont and Washington have also adopted ACT.3
CARB has also passed the Advanced Clean Fleets (ACF) rule. ACF targets MHDV fleets and is designed to build on ACT in accelerating compliance with the 2020 California Executive Order N-79-20, which states, “It shall be a further goal of the State that 100 percent of medium- and heavy-duty vehicles in the State be zero-emission by 2045 for all operations where feasible and by 2035 for drayage trucks.”4 The ACF rule has four key components:5
- Manufacturers may sell only ZE-MHDVs starting in 2036.
- Government-owned (city, county, district and state) fleets need to ensure 50% of MHDV purchases are ZEVs beginning in 2024 and 100% of purchases are ZEVs by 2027, with some caveats for smaller government agencies and near-ZEV purchases through 2035.
- All new purchases for drayage fleets, or trucks that move freight very short distances in and out of ocean ports or intermodal facilities, must be ZEVs starting in 2024, with the entirety of the drayage fleet being ZEVs by 2035. All drayage trucks must register with CARB, and any non-ZEVs in the drayage fleet can continue to operate through their minimum useful life.
- High-priority fleets must begin transitioning to ZE-MHDV fleets. High-priority fleets are defined as “entities with $50 million or more in gross annual revenue and that own, operate, or control at least one vehicle with a gross vehicle weight rating (GVWR) greater than 8,500 pounds, or are entities that own, operate, or control a total of 50 or more vehicles with a GVWR greater than 8,500 pounds.” High-priority fleets in California also must purchase only ZEVs beginning in 2024 and slowly transition their fleets to entirely ZEVs by milestone group (see Table 1).

CARB currently estimates that there are 1.8 million MHDVs operating in California daily, and 532,000 will be subject to ACF fleet requirements.5
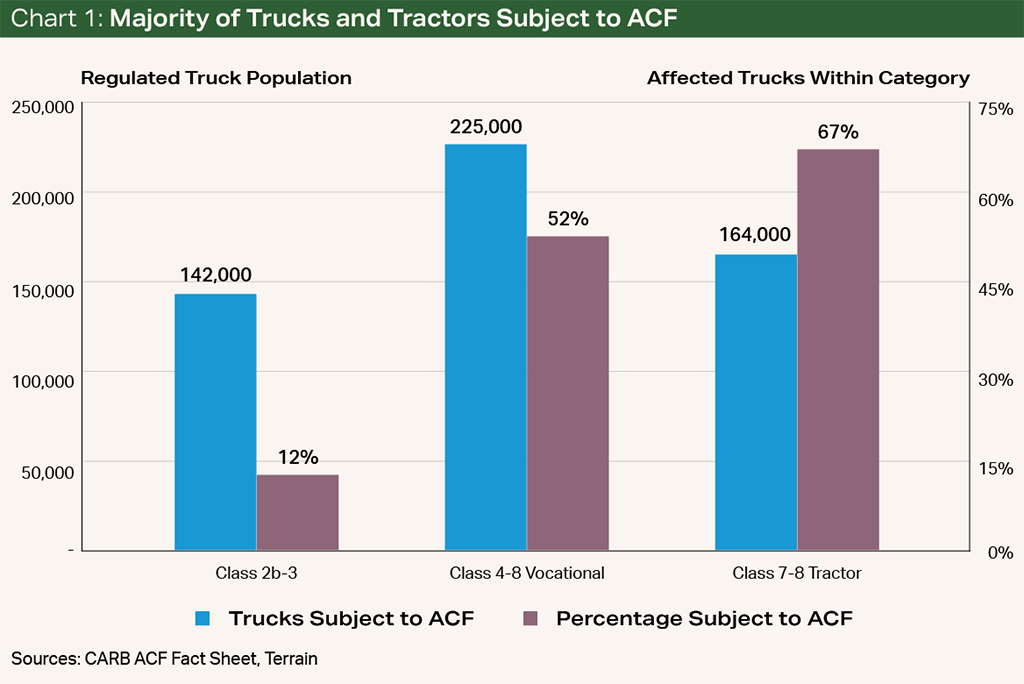
Exemptions may be possible for some fleet owners, however. CARB has recently issued a list of “Updated Flexibilities” that provide the possibility to receive an exemption under specific circumstances.6 For example, there is a potential provision for “fleet owners to apply for an exemption to purchase an ICE [internal combustion engine] vehicle if ZEVs are available in a given configuration, but do not meet the fleet’s daily mileage and stationary operational use needs.” This exemption might be appropriate for some producers with daily transportation needs that are outside of the current capacity of ZE-MHDVs. Additionally, there is a provision that allows for a delay in transitioning to ZE-MHDVs for areas where the infrastructure transition has also been delayed. Some farmers, agribusinesses, processors and transportation companies may find that portions of their operation fit into these exemptions, which will allow for a less disruptive transition for their business and the food supply chain.

Momentum Outside California
As for the rest of the U.S., there are currently no national regulations on transitioning MHDVs to ZEVs, but momentum for a transition has been building. For example, in November 2022, the U.S. joined the Global Memorandum of Understanding on Zero-Emission Medium- and Heavy-Duty Vehicles.7,8 The memorandum has the stated goal of 100% of new MHDV sales to be ZEVs by 2040 at the latest, with an interim goal of at least 30% of new MHDV sales to be ZEVs by 2030. Moreover, in the spring of 2022, the U.S. Department of Energy released a bevy of research on ZE-MHDVs. One study from the National Renewable Energy Laboratory estimated that ZEV sales could reach 42% of all MHDVs by 2030 and 80% of the total MHDV stock by 2050 across all MHDV types.9
Several large corporations have already begun to voluntarily transition some portions of their MHDV fleet to ZEVs. For example, PepsiCo’s snack division Frito-Lay owns and has trialed different ZE-MHDVs.10 Amazon has also purchased zero-emission delivery vehicles and is committed to transitioning all 100,000 delivery vehicles to ZEVs by 2030.11 As a result of this momentum, consulting firm McKinsey & Company has estimated that ZE-MHDV adoption in the U.S. will be greater than 30% by 2030.12
What Is the Direct Cost to Farmers and Producers Today?
Currently, the U.S. has not adopted a national plan to phase in ZE-MHDVs. This means the impact of the momentum for these vehicles is limited to states that have adopted both the ACT and ACF rules. The implications for farmers in states that have adopted ACT and ACF are twofold.
First, for farmers with fleets of fewer than 50 MHDVs or less than $50 million in gross revenue, the direct impact is likely to be mostly isolated to new purchases of MHDVs. Farms in this category would not be subject to any regulatory reporting and/or phase-out of their existing fleet. However, these farms would have to either purchase a ZE-MHDV and the supporting grid (charging stations, for example) or compete from the smaller supply of traditional MHDVs still available in these states until the sale cutoff date. In the long run, as manufacturers in ACT- and ACF-compliant states phase into offering only ZE-MHDVs, farmers will also have to transition.
In the long run, as manufacturers in ACT- and ACF-compliant states phase into offering only ZE-MHDVs, farmers will also have to transition.
Second, for large farms and agribusinesses based in a state that has adopted ACT and ACF, with fleets of greater than 50 MHDVs or more than $50 million in gross revenue, the initial direct impact will be the upfront costs of transitioning to ZE-MHDVs and the supporting grid. Recent analysis has shown that most zero-emission large-class trucks have an upfront cost of $300,000 to $500,000, compared with $130,000 to $160,000 for diesel trucks.13 Both California and New York have incentives to help offset a portion of the initial costs, and some studies indicate a longer-term saving from ZE-MHDVs due to lower operational costs.14,15 However, for many companies, there is likely to be a large upfront investment. California Executive Order B-48-18 has also set a goal of 250,000 public chargers, including 10,000 DC fast chargers, and 200 hydrogen fueling stations by 2025, which could help offset some grid transition costs.16
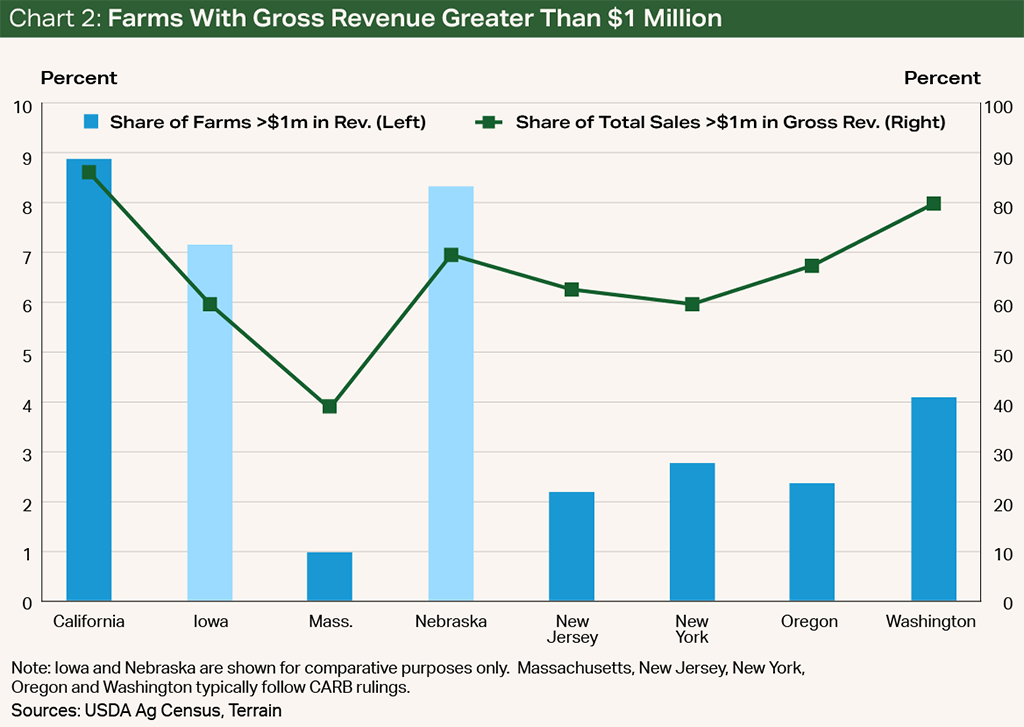
The number of traditional farms that would qualify as high-priority fleets is initially likely to be a smaller percentage of total farms but potentially a decent portion of total agricultural production. For example, according to the 2017 USDA Census of Agriculture, about 9% of California’s farms had gross sales above $1 million, well short of the ACF limits, but the majority of total farm receipts come from farms with gross revenue above $1 million. This is consistent with other large agricultural states and states that typically adopt CARB rulings such as Washington, Oregon, New York, New Jersey and Massachusetts. However, large processors of agricultural products and companies important to the food supply chain are more likely to fall under the ACT and ACF regulations.
Implications for the Agricultural Supply Chain and the Indirect Cost to Farmers
The agricultural supply chain will undergo significant change as a result of ACT and ACF. There are several groups that are likely to be impacted.
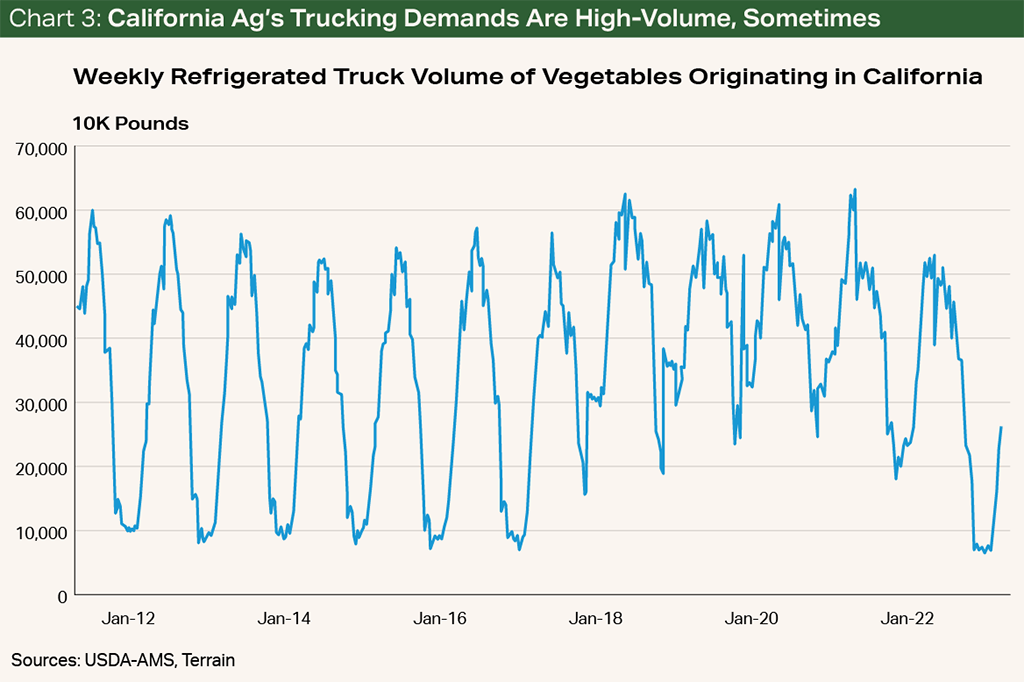
First, large transportation companies that cater to agriculture are likely to face supply chain challenges because of ACT and ACF. For example, some commodities such as tree fruits and nuts, vegetables, and melons have a very seasonal harvest window and therefore a very seasonal need for transportation. Farmers of seasonal commodities often elect to contract their transportation needs (from the field to the processor, for example) with transportation companies as opposed to personally owning an MHDV. The transportation companies that contract for hauling are typically larger businesses that could be subject to ACT and ACF. Therefore, as these transportation service companies transition to ZE-MHDVs, there will be concerns and discussions around the implications of driving range and charging capabilities in rural farming areas. Concerns over downtime for charging during harvest will also be heightened, particularly for very fungible and time-sensitive crops like fruits, nuts or vegetables. For example, the volume of refrigerated trucks moving vegetables, fruits and melons in California has very defined peaks in the harsh summer months of July to August and valleys in January. As a result, vegetable producers may have to overinvest in additional cold storage, more ZE-MHDVs than traditional MHDVs, or very complex charging grids to ensure that food products can be safely delivered to retail markets without waste.
Producers of commodities with continual production that require a high volume of reliable, and often daily, transportation from the farm to the processor also frequently partner with large transportation companies, cooperatives or processors with large fleets. An example would be a large dairy processor that sources milk daily from multiple dairies in their milk shed. Given the continual needs and fungible nature of dairy, the supporting ZE-MHDV network would need to be crafted very strategically to ensure minimal disruptions and downtime. Charging stations at both loading and offloading sites may help reduce some risk, but long-haul shipments could be concerning for fungible goods.
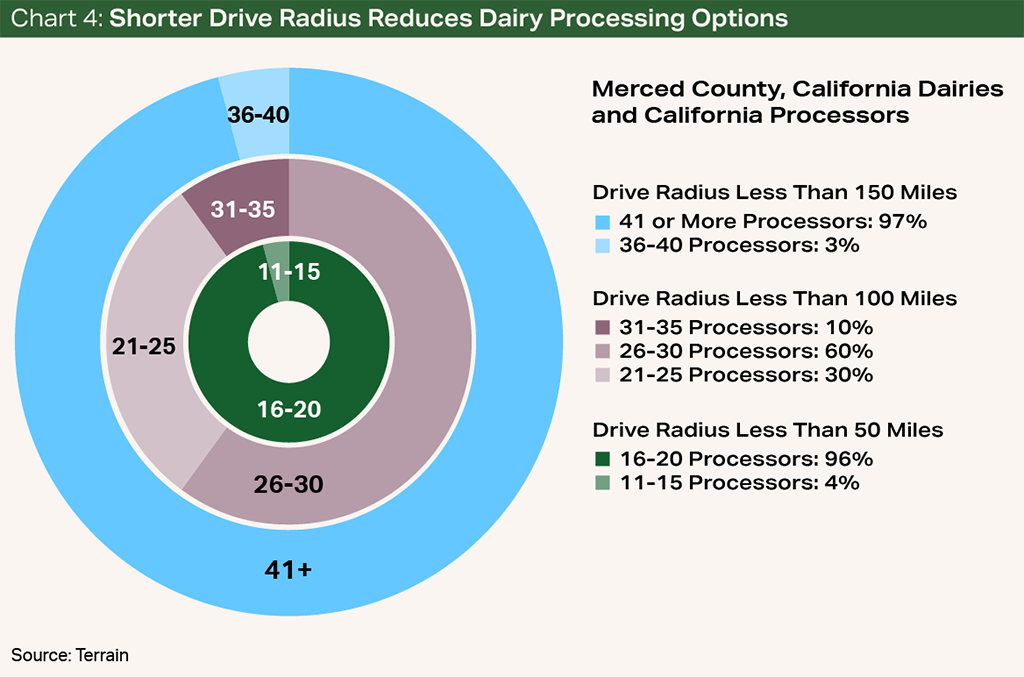
For example, Merced County, California accounted for a little more than 3%, or over $1 billion, of total U.S. milk sales in 2017.17 Geospatial analysis of 73 dairies and 77 milk processors indicates that most dairies in Merced County have about 16 to 20 milk processors within a 50-mile drive radius in this sample set. Comparatively, if the drive radius is widened to 150 miles, dairies in Merced County have access to 36 or more milk processors in the sample set.18 In this sample set, both the dairies and processors in a very short radius to each other would become hyperreliant on their collective ability to meet each other’s supply, demand and transportation needs. Any disruption to supply from the dairies, demand from the processors, or transportation handoffs would result in economic loss as the ability to move milk farther outside the localized supply chain becomes tighter. In short, the supply chain in this region would become much more microscopic and less resilient to shocks. Likewise, the shrinking radius of available processors (buyers) could have an adverse impact on the milk basis market.
The second segment of the food and agricultural supply chain likely to be disrupted is the process of moving finished food products from processors to the consumer. Since each commodity has a unique supply chain, the impact for each individual commodity will vary. Analysis of the California almond industry can give one example of the impact.
Traditionally, almonds are picked up in the field and moved (via an MHDV) to a location with hulling and shelling facilities. Some hulling and shelling facilities are integrated with a final good processing, but some are separate. Geospatial analysis of the distance between non-integrated hullers, shellers and processors indicates spatial disparities. For example, in aggregate, more than 70% of the 31 non-integrated hullers and shellers in the sample set have at least 20 processors located within a 100-mile drive range. However, around 36% of 53 non-integrated processors had an average drive distance to the 31 hullers and shellers of more than 100 miles in this sample set.
After almonds have been hulled, shelled and processed, they are then shipped to either domestic retail markets or ports for the export market. The export market consumes around 70% of almonds grown in California, and most almonds are shipped through the Port of Oakland or the Port of Long Beach.19
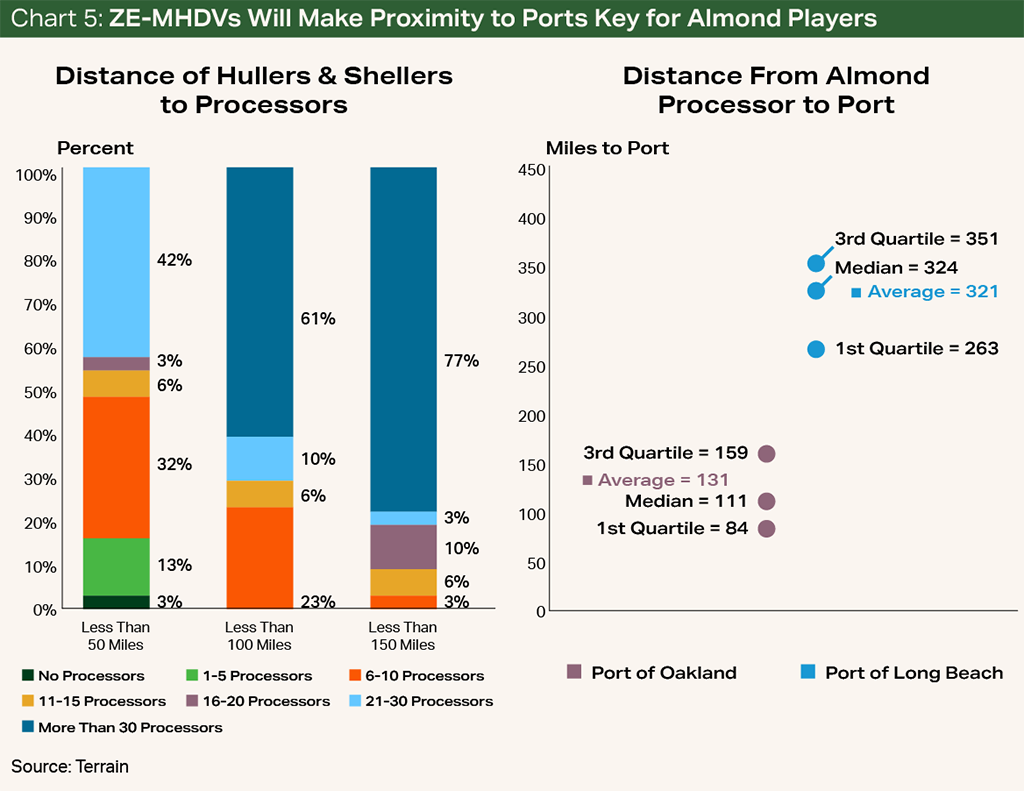
By geolocating 84 integrated and non-integrated almond processors, this study found that the median road distance from almond processors to the Port of Oakland is 111 miles, and the median road distance to the Port of Long Beach is 324 miles. About 42% of processors are positioned within 100 miles of the Port of Oakland, but no processor is located within 100 miles of the Port of Long Beach. Discouragingly, about a third of the processors analyzed are more than 150 miles from both ports.20
For processors, the large difference in proximity to port would likely make the industry more reliant on the Port of Oakland, or additional rail infrastructure could be built to transport almonds to the Port of Long Beach. Additionally, processors that are located farther from both ports may need to alter the price they pay to farmers for raw almonds to capture the cost of transportation increases. For example, the cost to pick up, haul and hull/shell almonds in the southern San Joaquin Valley is already about $12/acre more than in the northern San Joaquin Valley, according to the University of California, Davis.21
An integrated huller/sheller located farther from both ports than its peers may be forced to increase its fees to make up for charging time differences.
Shifts in costs may be hardly noticeable to the consumer but would be meaningful to certain producers.
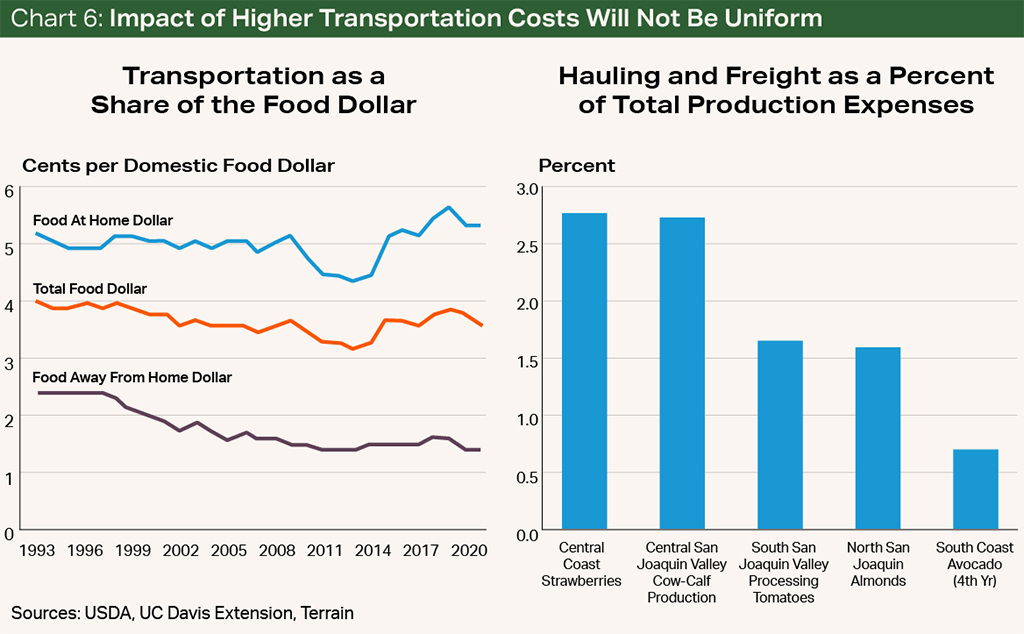
The final impact to the consumer for most commodities will be difficult to tease out. Traditionally, transportation makes up a smaller percentage of both the final food cost and total production expenses for farmers. For example, transportation as a share of each dollar spent on food is historically around 4%.22 Therefore, any cost or long-term saving could be washed out by other structural changes in agriculture and the food supply chain and somewhat unnoticeable to the consumer. Instead, producers located the farthest from processors and processors located the farthest from ports will likely feel the majority of the impact. For most commodities in California, the cost of hauling and freight is very low in the current supply chain system, but profit margins are typically very tight. Shifts in costs may be hardly noticeable to the consumer but would be meaningful to certain producers.
Thinking Longer Term About the Agricultural Supply Chain
The current ZE-MHDV regulations impact a very targeted and important region of agriculture. In 2021, California represented 11% of national ag receipts, the largest of any state.23 However, if the movement becomes national, there are many other rural, farm-centric areas that are currently not well-prepared for the transition.
For example, Kansas and Nebraska combined account for around 37% of the nation’s cattle on feed. Most cattle in Kansas and Nebraska are processed by nearby facilities. However, the current public EV grid is very sparse, particularly in the rural areas where feedlots and beef packing plants are located. The map below plots beef feedlots, beef processing plants, and public DC fast charging stations. Notably, there is a gap in public charging stations near feedlots and beef processors.24
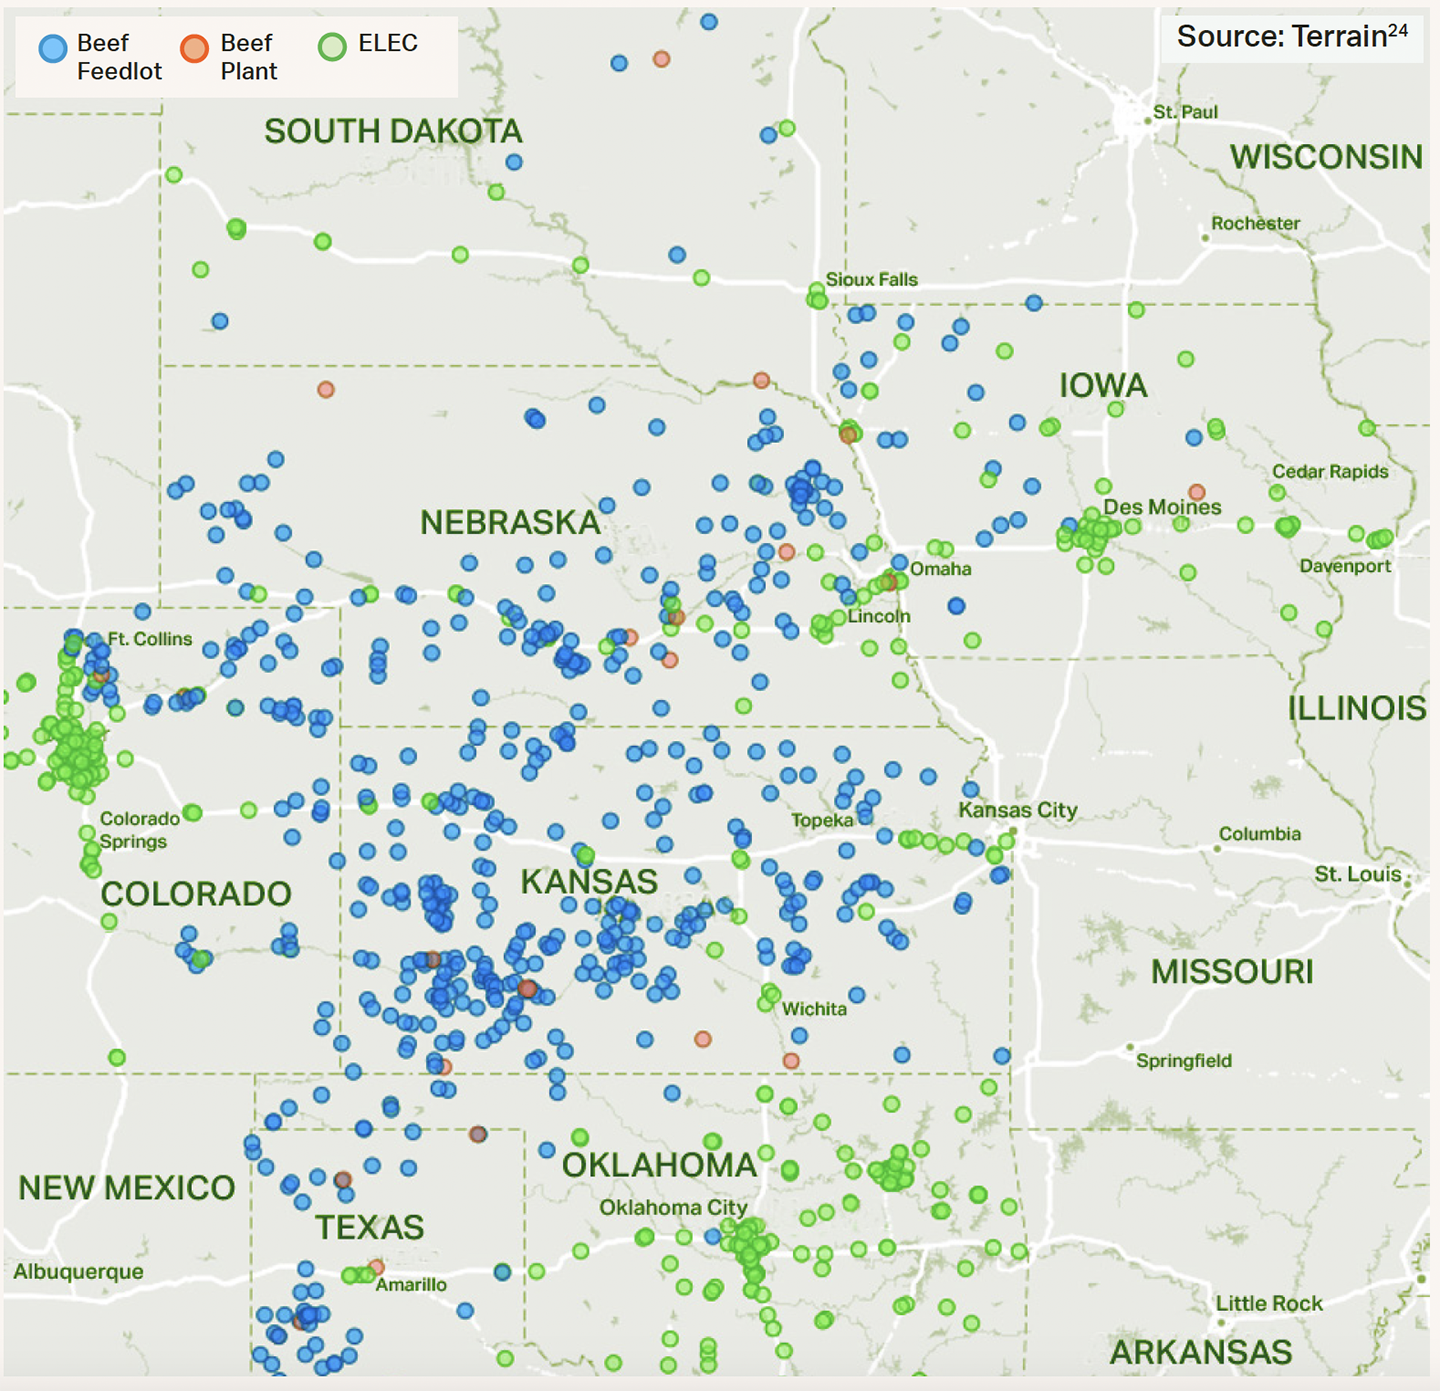
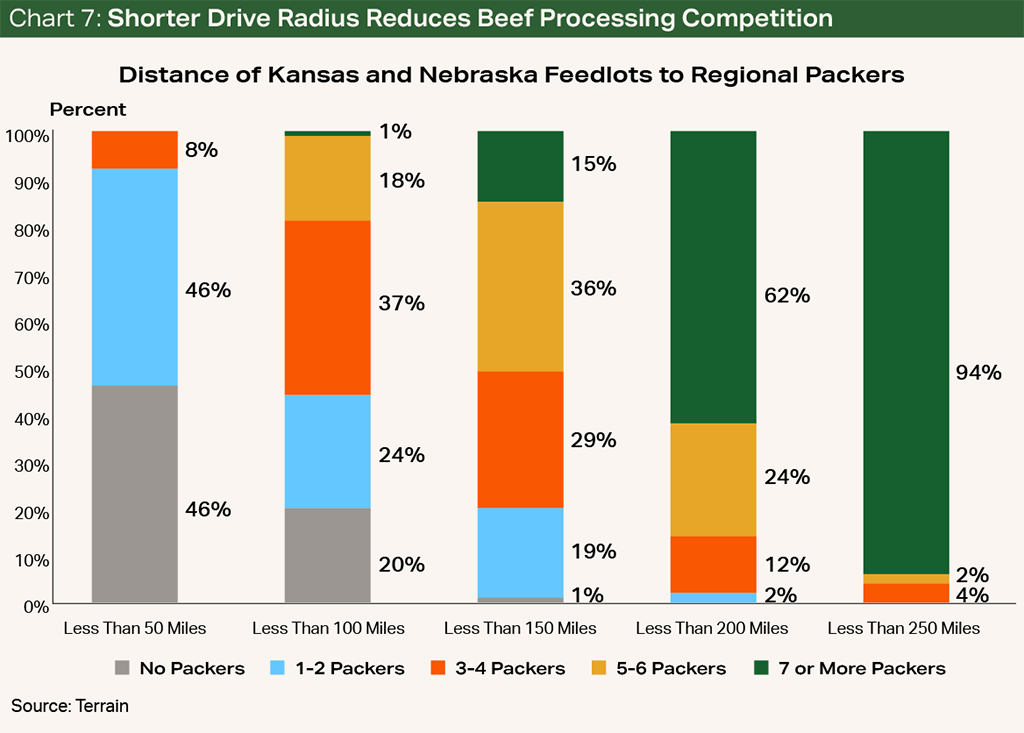
Most feedlots are located near beef packers. However, given animal welfare issues, feedlots, packers and transportation services would not want to risk hauls that could require downtime to charge, especially in harsh winter or summer months. Depending on the driving range of ZE-MHDVs, the available feedlot options for packers to procure beef could shrink sharply and have serious implications for prices paid between feedlots.
For example, if a loaded ZE-MHDV could travel only less than 100 miles, around 20% of feedlots would not be able to haul directly to a packer without stopping to charge. In this scenario, feedlots with fewer packers within a drivable radius would receive hefty price discounts and would be less competitive in attracting the placement of cattle. A further study of transportation needs, ZEV driving range, grid capacity and the like would be necessary before any large-scale ZEV movement is applied to agriculture. This is particularly true in animal agriculture, as research has shown that the average fed cattle travels more than 1,250 miles in its lifetime.25 The implications of the cost to the farmer and the consumer could be far-reaching.
Evolving Rules Will Determine the Degree of Disruption
The implementation of ACT and ACF does have implications for farmers and the agricultural supply chain, chiefly in California. For affected farmers, agribusinesses, processors and transportation companies that cater to agriculture in California or other states that comply with the ACT and ACF rules, the transition to ZE-MHDVs and the supporting grid would include initial upfront costs. The supply chain is also likely to feel some disruption as transportation readjusts to the infrastructure, driving ranges and charge time. In the meantime, eligible farmers, agribusinesses, processors and transportation companies could see some relief from exemptions, which would allow for a less disruptive transition for their business and the food supply chain. Still, further research into ZE-MHDV ranges and infrastructure needs in rural and farm-centric areas, as well as detailed assessments of agricultural supply chains, would add to the discourse and help assign a dollar value to the transition and identify key areas where public investment through California Executive Order B-48-18 could help offset potential losses. If the driving range of ZE-MHDVs is found to be significantly less than that of traditional MHDVs, there will likely be some significant holes in the agricultural and food supply chain that could make the system much less resilient.
Works Cited and Notes
1 Matt Roberts, “Ethanol vs. Electrons: The Future of Fuel,” Terrain, https://www.terrainag.com/insights....
2 California Air Resources Board, Advanced Clean Trucks Fact Sheet, https://ww2.arb.ca.gov/resources....
3 Susan Carpenter and Taylor Torregano, “EPA allows California to proceed with zero-emission truck regulation,” April 2, 2023, Spectrum News, https://spectrumnews1.com/ca/la-west/environment....
4 Executive Department State of California, Executive Order N-79-20, https://www.gov.ca.gov...pdf.
5 California Air Resources Board, Advanced Clean Fleets Regulation Summary, https://ww2.arb.ca.gov/resources/fact-sheets....
6 California Air Resources Board, ACF Proposed Changes, https://ww2.arb.ca.gov/resources....
7 Drive to Zero, “COP27: USA, Ukraine, Ireland, Aruba, Belgium, Croatia, Curaçao, Dominican Republic, Liechtenstein, Lithuania Sign Global MOU, Support Path to 100% New Truck and Bus Sales By 2040,” November 17, 2022, https://globaldrivetozero.org....
8 Memorandum of Understanding on Zero-Emission Medium- and Heavy-Duty Vehicles, https://globaldrivetozero.org/...pdf.
9 Catherine Ledna, Matteo Muratori, Arthur Yip, Paige Jadun and Chris Hoehne, “Decarbonizing Medium- & Heavy-Duty On-Road Vehicles: Zero-Emission Vehicles Cost Analysis,” National Renewable Energy Laboratory, March 2022, https://www.nrel.gov/docs/fy22osti/82081.pdf.
10 Steven Loveday, “Tesla Semi Details From Frito-Lay Visit,” Inside EVs, January 26, 2023, https://insideevs.com/news....
11 Amazon staff, “Amazon’s electric delivery vehicles from Rivian roll out across the U.S.,” July 21, 2022, https://www.aboutamazon.com/news....
12 Enrico Furnari, Lionel Johnnes, Alexander Pfeiffer and Shivika Sahdev, “Why most eTrucks will choose overnight charging,” McKinsey & Company, October 2020.
13 Brian Wang, “Shopping Guide for Electric Semi Trucks,” Next Big Future, December 29, 2022, https://www.nextbigfuture.com....
14 California Hybrid and Zero-Emission Truck and Bus Voucher Incentive Project, “Incentives for Clean Trucks and Buses,” https://californiahvip.org/.
15 Saral Chauhan, Malte Hans, Moritz Rittstieg and Saleem Zafar, “Fleet decarbonization: How an expanding value chain could reshape freight,” McKinsey & Company, March 2023.
16 California Executive Order B-48-18, https://www.library.ca.gov...pdf.
17 2017 USDA Ag Census.
18 Milk processing plant data was gathered from the Federal Milk Marketing Order 51 and the California Department of Food and Agriculture, https://www.cdfa.ca.gov/dairy/xls/cadairyplantlist.xlsx. The sample set was refined down to milk plants that could be physically geolocated, determined to be currently operating, and received only cow milk. Some very specialized processors were also not included because of the amount of milk needed. Dairy data was gathered using Google Earth and search results.
19 Almond Board of California, “Key Issues & Fast Facts 2021,” https://www.almonds.com...pdf.
20 Geo-analysis of the almond industry was performed using Google Earth and search results. The research identified 53 almond processor facilities that were not integrated with a huller/sheller, 31 integrated almond processor facilities, and 31 huller/shellers that did not have processing capabilities. The overall sample size was thought to be representative of the industry.
21 University of California Agriculture and Natural Resources Cooperative Extension, Agricultural Issues Center, UC Davis Department of Agricultural and Resource Economics, "Sample Costs to Establish an Orchard and Produce Almonds,” 2019.
22 USDA Economic Research Service, Food Dollar Series, last updated February 15, 2023.
23 USDA Economic Research Service, Farm Finance Indicators, State Ranging, 2021, https://data.ers.usda.gov/reports.aspx?ID=17839.
24 Geo-analysis of the cattle feeder industry was performed using Google Earth and search results. The research identified 234 feedlots that were thought to be able to feed at least 5,000 head and considered 16 beef packer plants located in Colorado, Iowa, Kansas, Nebraska, South Dakota and Texas. Data for public DC fast charging stations was gathered from the U.S. Department of Energy’s Alternative Fueling Station Locator in September 2022. Note: The map generated for this report is at a 30,000-foot level and should be viewed as a sample snapshot at a point in time.
25 Don Close, “Livestock Transportation Costs,” Terrain, https://www.terrainag.com/insights/livestock-transportation-costs/.
Terrain content is an exclusive offering of AgCountry Farm Credit Services,
American AgCredit, Farm Credit Services of America and Frontier Farm Credit.