The Rural Economist – Fall 2024
In my travels across farm country, young and beginning farmers often ask questions that force me to think differently about agriculture. The questions also shed light on issues that are likely to surface in the coming years, signaling what the industry’s next leaders see as barriers and challenges they must contend with.


Cash and Corn
During a corn and soybean outlook event, a younger producer asked if the sharp rise in cash rental rates has locked producers in the corn belt into growing more corn on cash-rented ground. My initial response was that as cash rents increase, typically corn becomes more favorable relative to soybeans from a cash flow perspective due primarily to yield potential and consistency. For example, cash rent payments in Iowa have consumed about 30% of gross corn revenue and 40% of gross soybean revenue since 2008, according to USDA budgets.
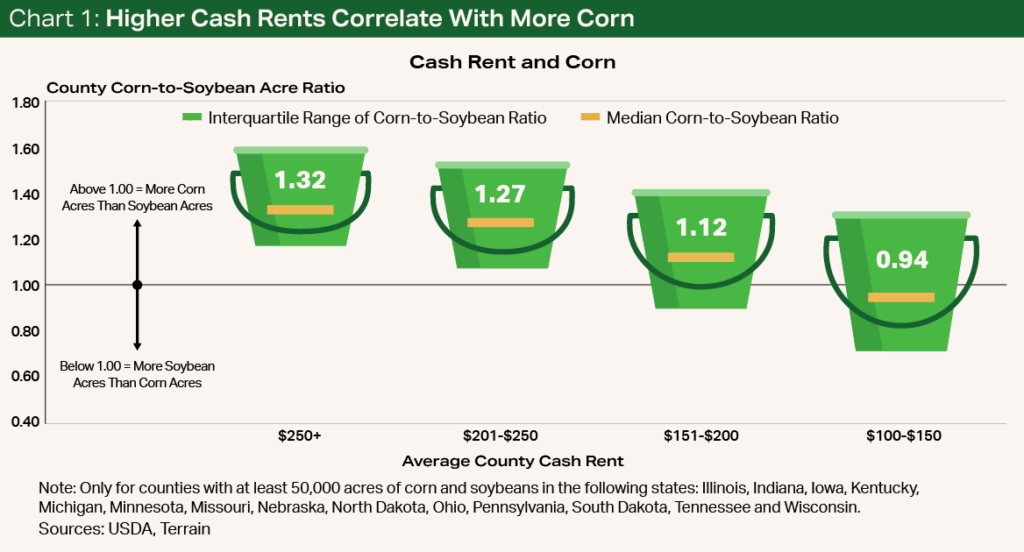
When I returned to my desk, I decided to stress-test my answer. Using the USDA’s database, I calculated the corn-to-soybean acre ratio for nearly every county in the “expanded” corn belt with at least 50,000 acres of production and an average cash rent above $100 per acre since 2008 — nearly 7,000 samples.
As cash rents increased from one bucket to the next, acres became more concentrated in corn (see Chart 1). In counties with an average cash rent above $250 per acre, the median corn-to-soybean acre ratio was 1.32, but in counties with an average cash rent of $100 to $150 per acre, the ratio was just under 1. Nationally, the ratio of corn acres to soybean acres has averaged 1.11 and ranged from 1.26 to 0.99 since 2008.
Continued pressure on cash rents may inadvertently lead to crop acres being more heavily allocated to corn.


Farmer Age in a Different Light
Farm transition planning is a regular discussion point and source of angst with young and beginning farmers. A younger farmer recently asked me a two-part question, though, that revealed how he’s looking at near-term opportunity to expand:
- Are farmers older than other workers, and
- Is the average farmer age bumping up against average life expectancy?
While there has been a lot of literature on the average age of the farmer, this question hinted more at a relative tipping point for when young and beginning farmers should be prepared for transition. Terrain felt that this question was so good that we plan to write a series on farmer demographics, but here is a short teaser of some of the forthcoming analysis.
The median farmer and rancher age in 2023 was 56, the highest of any occupation.
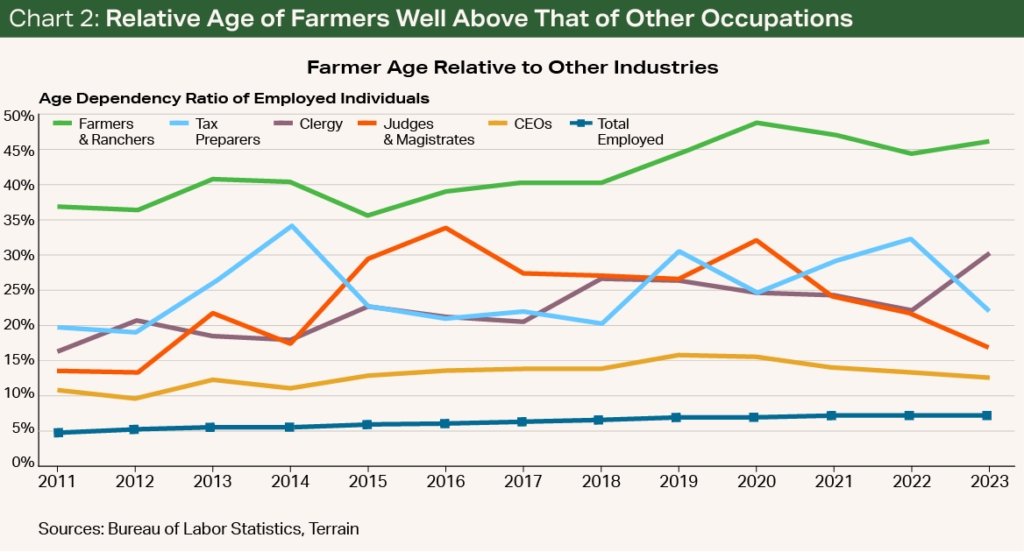
In terms of farmer age relative to other industries, farmers are much older. According to the Bureau of Labor Statistics, the median farmer and rancher age in 2023 was 56, the highest of any occupation and 14 years older than the median age of all employed workers. The next group of occupations near the median age of farmers includes crossing guards, bus drivers, legal secretaries, facility managers, property appraisers, judges, chief executives and clergy.
Perhaps a better measure of relative age is to consider the number of workers older than 65 as a percentage of workers age 16 to 64 (often referred to as the age dependency ratio, but the official ratio is more commonly applied to total populations, not just employed people). This ratio when applied to employed farmers and ranchers is just under 50%, well above any other occupation (see Chart 2). To put this into perspective, the age dependency ratio for Japan’s total population is 51.4%, and Japan is considered the most elderly country in the world.
This calculation helps clarify that although the average age of the farmer has increased without too much disruption, there is a significant difference between the number of farmers aging out and the number of farmers coming in. Hence, there will come a tipping point.

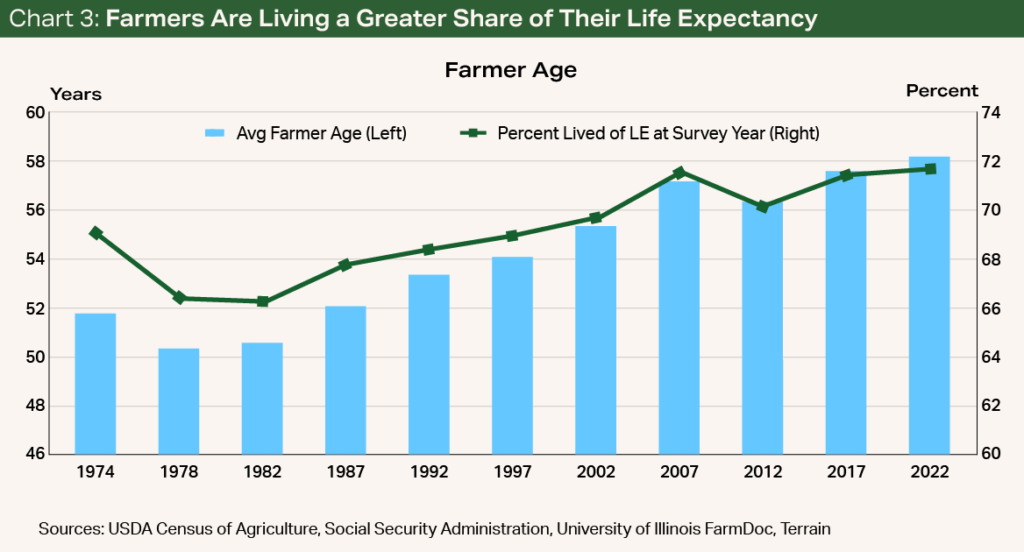
How much older can the average age of farmers go? Although the average farmer age has steadily increased since the late 1970s, life expectancy has also slowly ticked up. However, using the Social Security Administration’s life expectancy tables, the age of the average farmer has outpaced the increases in expected life. Currently, the average farmer has lived a greater percentage of their life than in the previous six decades. The percentage of life expectancy that the average farmer has lived has increased from two-thirds in 1978 to 72% in 2022 (see Chart 3).
There will, at some point, be a tipping point to larger-scale transitions at the farm gate.


Borrowing Base Barriers
Another younger farmer asked why it felt like his ability to borrow had declined even though he has had several years of income growth. In my opinion, the answer isn’t just about lending requirements and projected cash flows, but instead a more fundamental balance sheet readjustment occurring in farm country that has a disproportionate impact on younger farmers.
Surveys from the Federal Reserve indicate that collateral requirements have increased for agricultural banks in Chicago, Dallas, Kansas City, Minnesota and St. Louis. However, these bank surveys have only reported a decline in collateral requirements three times in 573 reporting periods. So, while collateral requirements probably have increased, particularly in light of lower bank liquidity, the bigger barrier in my opinion is a discrepancy in balance sheet composition.
The USDA’s Agricultural Resource Management Survey indicates the wide difference in balance sheet composition between young farmers and older farmers. The balance sheet of the latter group is made up of almost entirely farm real estate, presumably acquired over several decades. The balance sheet of younger farmers is about two-thirds farm real estate and contains a heavier dependence on farm equipment (see Chart 4).
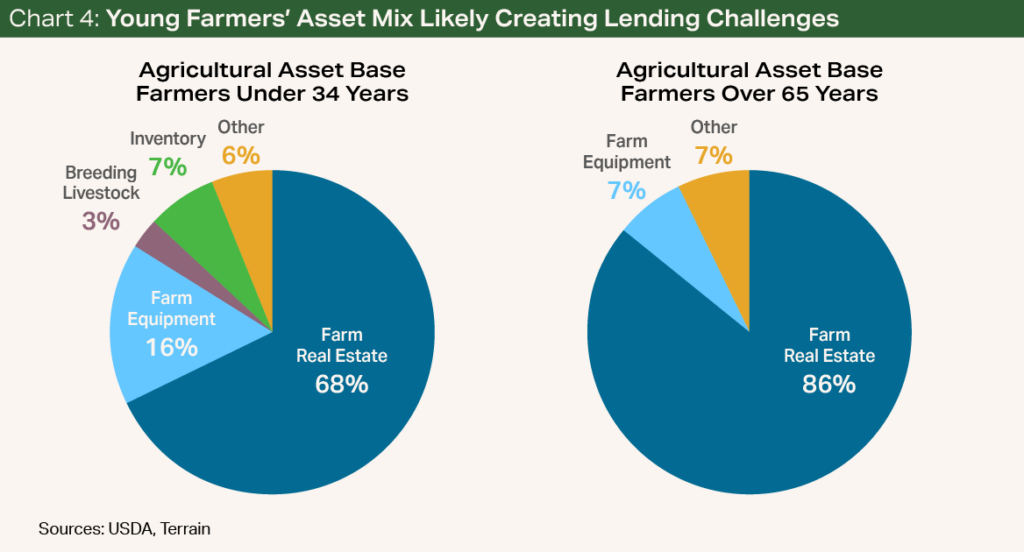

Balance sheet positions and the ability of younger farmers to borrow may be tightening, even if their total debt level remains the same.
The difference in balance sheet composition is likely the culprit for borrowing base barriers. Used farm equipment has significantly declined in resale value and is typically used as collateral only in shorter-term loans given the normal rate of depreciation. Moreover, most of the farm real estate owned by younger producers has likely been accumulated at the peak of the farmland market. As farmland values have flattened in most of the Midwest, or declined in large portions of California, the available equity from these assets is likely very limited. As a result, balance sheet positions and the ability of younger farmers to borrow may be tightening, even if their total debt level remains the same. For producers who are taking on additional debt, the impact to their borrowing ability is twice felt.
For producers who are taking on additional debt, the impact to their borrowing ability is twice felt.


Sluggish Rural Economies
Many of the younger farmers, and/or their spouse, tend to have off-farm or secondary jobs in their rural communities and have commented that their local economies feel sluggish compared with the macroeconomy. These farmers are curious as to how bad the rural economy is compared with the rest of the economy. For many, this feeling is likely exacerbated due to flattened farmland values and tight farm incomes in comparison to their suburban counterparts who have experienced strong appreciation in home values, equities and likely wages.
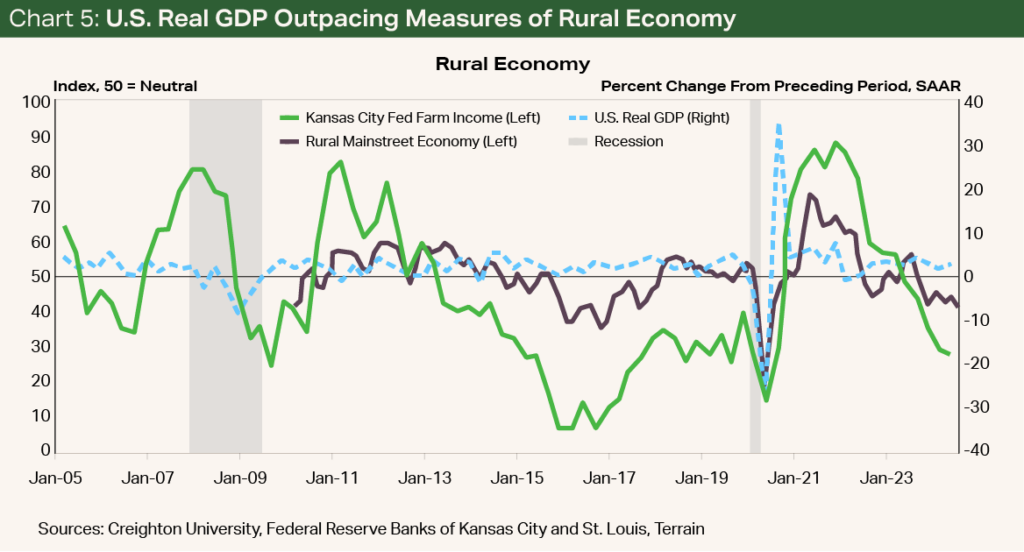
The “rural economy” can be difficult to untangle, but Creighton University’s index for the Rural Mainstreet Economy and the Kansas City Fed’s Ag Credit Survey are useful tools for comparison purposes. The Rural Mainstreet Economy index does typically track with farm income surveys and has recently fallen into contraction territory. In comparison, U.S. real GDP has risen above both of these measures and has continued to show strong growth even as the measures of the rural economy have sunk (see Chart 5).

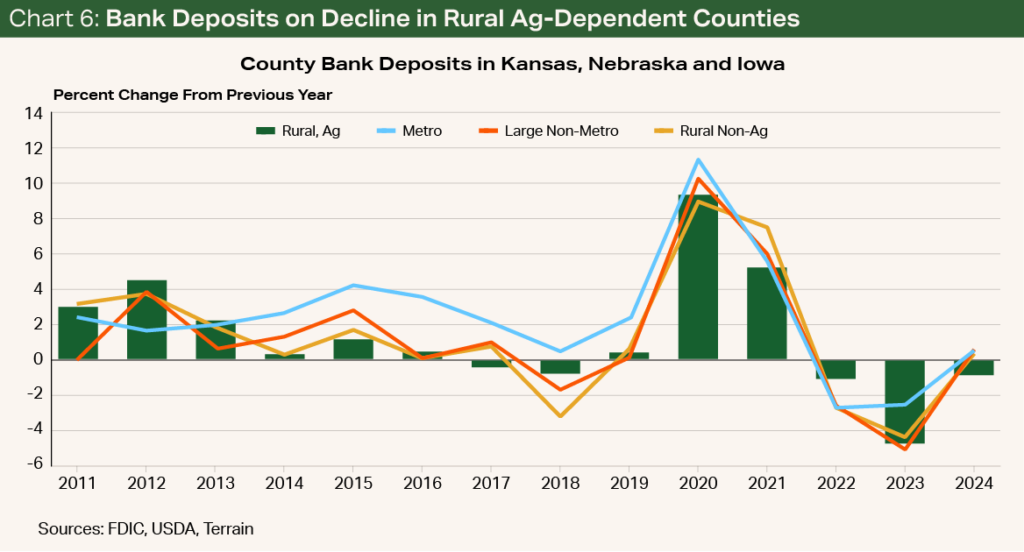
Commercial bank deposits by county also help shed light on how different economies are faring. Inflation-adjusted deposits increased from the previous year in metropolitan counties, large nonmetropolitan counties, and rural counties without an economic dependency on agriculture. However, deposits in rural counties with an economic dependency on agriculture declined for the third consecutive year. In real terms, the total bank deposits in rural counties with an economic dependency on agriculture are smaller than in 2020 (see Chart 6).


Terrain content is an exclusive offering of AgCountry Farm Credit Services,
American AgCredit, Farm Credit Services of America and Frontier Farm Credit.