Outlook • May 12, 2025
May 2025 WASDE Sets the Stage for Markets


In This Issue
- Corn and soybean ending stocks were lower than the average trade expectation, while wheat was higher.
- Despite a projected record-large U.S. corn crop in 2025/26, strong domestic and global demand are expected to keep global ending stocks tight.
- While U.S. soybean demand is expected to rise in 2025/26 with record-high domestic crush, the world’s soybean supplies are expected to expand further next year due to continued expansion from Brazil. U.S. soybean supply, however, could get tight if adverse weather conditions occur over the summer.
Current Conditions & Pre-Report Expectations
Planting season across the United States remains ahead of schedule for both corn and soybeans. As of May 11, 2025, U.S. corn was 62% complete—6 percentage points ahead of the five-year average—while U.S. soybeans were 48% complete, surpassing their five-year average by 11 percentage points. While planting progress is strong in many regions, the ultimate impact on yields and production will depend on weather conditions throughout the growing season. The May 2025 World Agricultural Supply and Demand Estimates (WASDE) provided the first projections of supply and demand for the new marketing year.
Market expectations for U.S. yields in both corn and soybeans showed little variation, with most estimates aligning at 181 bushels per acre for corn and 52.5 bushels per acre for soybeans. Analysts generally anticipated that USDA would maintain the yield estimates reported at the 2025 Ag Outlook Forum in February.
For marketing year 2025/26, one of the biggest market takeaways was that corn and soybean ending stocks were lower than the average trade expectation, while wheat was higher.
Compared to expectations, the report was generally neutral-to-bullish for corn, bullish for soybeans, and bearish for wheat. A detailed analysis for each commodity follows.
Pre-Report Expectations for May 2025 WASDE Estimates

Corn: 2025/26 Outlook
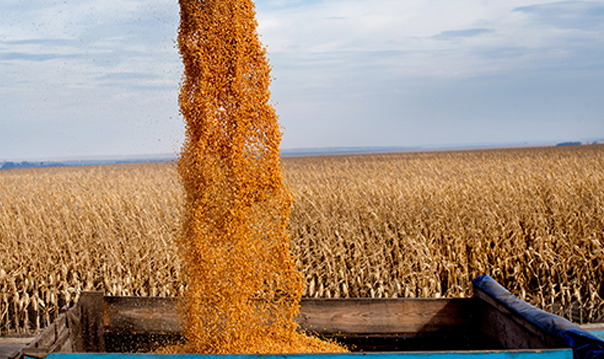
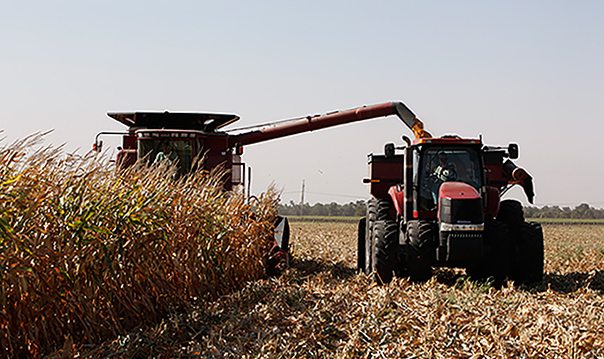
The U.S. corn outlook for 2025/26 is for record U.S. production and yield per acre (thus record total supplies), with domestic consumption also expected to be a record. All said, the report’s outlook was neutral-to-bullish for new-crop corn.
Supplies
U.S. domestic supply forecast is 95.3 million planted acres and 87.4 million harvested acres, both up 5% compared to last year. If realized this would be the highest planted and harvested area in over a decade, and with projected national average yield at 181 bu./ac., total production would be the largest U.S. corn crop ever, increasing over 950 million bushels over last year to 15.82 billion bushels.
As expected, USDA maintained its assumption of record yields with the assumption of normal planting progress and summer growing weather. Given that old-crop 2024/25 exports were increased 50 million bushels, new-crop beginning stocks are tighter at 1.415 billion bushels (125 million bushels less than USDA’s original estimate of 1.54 billion bushels from the annual Outlook Forum in February).
Usage
U.S. consumption in projected at 15.46 billion bushels for 2025/26, increasing over 1% year over year with higher domestic use in feed and rising exports. Total domestic use is expected to be a record at 12.785 billion bushels.
Feed demand is expected to increase 150 million bushels or 3% year over year, based on the assumption of higher domestic supplies and lower prices.
Export demand is expected to increase 3% year over year based on the assumption of lower prices increasing world trade, with the U.S. continuing to be the world’s top exporter. When compared to USDA’s first estimate from the annual Outlook Forum at the end of February 2025, new-crop exports have increased another 275 million bushels to 2.675 billion bushels.
Ethanol demand is expected to be flat year over year at 5.5 billion bushels, assuming flat gasoline consumption and exports. If nationwide E15 sales are extended beyond the summer months, there could be positive demand upside for higher corn grind.
Ending Stocks and Price
Ending stocks for 2025/26 are expected to increase 385 million bushels year over year due to record supply outpacing record domestic demand. As a result U.S. stocks-to-use are expected to increase 2.36%, contributing to the average farm price declining 3% to $4.20 for marketing year 2025/2026.

Global production is forecast to increase to 1.265 billion metric tons, driven by increased production in the U.S., Ukraine and Argentina. Global consumption is expected to be a record – increasing 2% from last year to 1.274 billion metric tons. Global imports are also expected to increase, driven by China, Vietnam, the EU, Venezuela and Iran. While other global producers of corn are expected to increase exports, the second-largest exporter behind the U.S.—Brazil— continues to increase domestic demand, which could limit their export growth.
Ending global stocks are expected to further tighten—down 9.5 million tons to 277.8 million tons; if realized, this would be the lowest ending stocks in the past 12 years.
What Does This Mean for U.S. Corn Producers?
The increase in old-crop corn exports brings a much-needed reduction in old-crop ending stocks, and therefore new-crop beginning stocks, making the report neutral-to-bullish for new-crop corn. The U.S. is in an excellent position to meet the globe’s increasing corn demand by increasing exports. Stocks-to-use tightened from USDA’s annual Outlook Forum at 12.9% to 11.64%, although USDA left the average farm price unchanged at $4.20/bu.
While this marks the fourth consecutive year that the USDA has projected yields above 180 bu./ac. (a target that has yet to be reached nationally), weather during the critical growing periods will be the ultimate factor of final yields and thus new crop production. Farmers should continue to monitor the weekly crop progress report and the weather in July and August, as any reductions to new-crop supply would tighten stocks-to-use and would be positive for prices to potentially increase. Additionally, any reductions in global supplies would also prompt an increase in U.S. exports, further reducing supplies, and would be supportive for higher prices.
Soybeans: 2025/26 Outlook
Markets ahead of the May WASDE report anticipated stable yield projections but remained cautious amid demand uncertainty. Industry analysts expected the USDA to maintain its February Ag Outlook Forum yield estimate of 52.5 bushels per acre, with little deviation. They expected correctly. Market participants closely monitored global trade—particularly Chinese demand—and domestic crush margins, both key factors influencing soybean usage. Additionally, South American production outlooks and currency fluctuations shaped overall sentiment. While ample soybean supplies were expected, concerns over economic growth and export competitiveness kept traders wary of price movements and stock accumulation heading into the 2025/26 marketing year.
The May WASDE report was broadly bullish for soybeans, driven by strong usage and lower projected carryout for both 2024/25 and 2025/26. USDA estimated 2024/25 ending stocks at 350 million bushels, positioning them at the low end of the trading range and 21 million bushels below the average trade estimate. For 2025/26, USDA projected ending stocks at 295 million bushels—also at the lower end of the range and 85 million bushels below pre-report expectations. Additionally, global ending stocks projections for 2025/26 fell below trade estimates.
By mid-day on May 12, July 2025 soybean futures rose $0.18 per bushel to $10.70, while November 2025 contracts gained $0.25 to $10.56 per bushel.
Supplies
For 2025/26, USDA projects slightly lower supplies, increased crush demand, reduced exports and lower ending stocks compared to the prior year. Based on the March 31 prospective plantings survey, U.S. farmers are expected to plant 83.5 million acres of soybeans and harvest 82.7 million acres, with trend-line yields of 52.5 bushels per acre—1.8 bushels per acre higher than in 2024/25. If realized, total supplies would exceed 4.7 billion bushels, 2.4% above the 10-year average.
Usage
USDA forecasts total domestic soybean usage at over 4.4 billion bushels, up 31 million bushels from 2024/25, marking the third-highest usage on record. Increased crush demand, driven by stronger soybean meal consumption and exports, is projected to rise by 70 million bushels. Domestic soybean meal disappearance is expected to grow by 2% due to higher pork and poultry production, while U.S. soybean meal exports are forecast to increase by more than 3.4% compared to 2024/25.
U.S. soybean exports are projected to decline by 35 million bushels from the prior marketing year. Brazil’s record-large expected soybean crop is likely to enhance its competitiveness in global markets. If realized, U.S. soybean exports in 2025/26 would be 7.5% below the 10-year average.
Ending Stocks and Price
USDA’s projected ending stocks of 295 million bushels fell below market expectations of 380 million bushels, though pre-report industry estimates ranged as high as 675 million bushels, reflecting uncertainty in trade policy ahead of the May WASDE report.
At 295 million bushels, ending stocks would be 24% below the 10-year average and nearly in line with the 5-year average. The stocks-to-use ratio is expected to reach 6.7%, marking the lowest level since 2022/23 and falling below the 5-year and 10-year averages of 6.9% and 9.3%, respectively.
Any summer weather disruptions could further tighten domestic soybean supplies if crush demand remains strong and exports hold steady following the May WASDE report. Additionally, USDA revised old-crop 2024/25 soybean ending stocks down by 25 million bushels, reflecting an upward adjustment in soybean export estimates.
The average price for the 2025/26 U.S. marketing year is projected at $10.25 per bushel, a $0.30 increase from the previous year.

South American soybean production remains a focal point, with Brazil's output projected to reach a record 175 million tons—up 6 million from the previous year's record high. Meanwhile, Argentina's production is forecast at 48.5 million tons, a decline of 0.5 million, as acreage shifts from soybeans to corn.
For 2025/26, USDA projects global ending stocks at a record 124.3 million metric tons while global soybean consumption is expected to rise approximately 3.4%. As consumption growth outpaces stock increases, the world stocks-to-use ratio is projected at 29.2%—above the 10-year average of 28.2% but 0.6 percentage points lower than in 2024/25.

What Does This Mean for U.S. Soybean Producers?
Despite the bullish outlook, trade and geopolitical uncertainty remain key risks, exacerbated by the potential for another record-large soybean crop from Brazil. Given the likelihood of volatility in the months ahead, producers should continue monitoring market developments and stress-testing their break-evens to manage uncertainty.
Wheat: 2025/26 Outlook
The 2025/26 outlook for U.S. wheat is for larger supplies, almost-flat domestic use, lower exports, higher ending stocks, and lower average farm prices.
Supplies
The larger supplies are a result of larger beginning stocks more than offsetting lower projected production and imports. U.S. production estimates for all wheat, all winter wheat, and the three classes of wheat surveyed exceeded their average pre-report estimates. The 2025/26 all-wheat yield is projected at 51.6 bu./ac., up 0.4 bu./ac. from 2024/25.
While there are pockets of dryness or drought in some winter wheat growing regions, crop conditions are currently mostly favorable for the winter wheat crop with over 50% of the crop rated good to excellent, above that of the prior four years for this time of year. A 1.3 million-acre reduction in harvested area, from both lower planted area and a lower harvested ratio, contributed to the lower overall U.S. production estimate despite the higher projected yield.
Usage
Domestic use is projected up just 2 million bushels, due to slightly higher food use. Both feed use and seed use are projected flat at 120 million bushels and 62 million bushels, respectively.
Exports are projected to decline 20 million bushels to 800 million bushes for the 2025/26 marketing year, despite lower prices. With production and exports projected to rise in many major foreign exporting countries, U.S. wheat producers are expected to face strong competition from foreign rivals in the year ahead.
Ending Stocks and Price
This combination of factors weighs on the U.S. all-wheat price, bringing the 2025/26 season-average farm price down to $5.30/bu, down $0.20/bu from the current year.
Globally, the USDA projects record high wheat production led by a projected rebound in wheat production in the European Union, where weather and conditions have generally been favorable both last fall and so far this spring, Higher projected production in Russia, Canada, India and Argentina is also adding to the global estimate. This rebound more than offsets projected lower production in Australia and Kazakhstan as those countries return to average yields following above trend yields last year.
Global trade is projected to increase in 2025/26 led by larger projected exports in four major markets: Russia, European Union, Australia and Argentina. Lower projected prices should help incentivize higher global use, which is currently projected to increase 0.5% in 2025/26, reaching almost 808 million metric tons.
Global ending stocks for 2025/26 are projected at 265.7 million metric tons, up slightly from the revised 2024/25 ending stocks, but exceeding the average pre-report estimates.
What Does This Mean for U.S. Wheat Producers?
This report was largely bearish for wheat as U.S. production exceeded the average trade estimate for all classes surveyed. Meanwhile, total demand is projected to fall compared to last year as U.S. exports face strong foreign competition. With current supplies projected to exceed total demand (including exports), U.S. ending stocks are forecast to exceed 900 million bushels, leading to lower projected all-wheat farm prices for 2025/26.
Despite the currently bearish outlook, unanticipated changes in supply or demand expectations could provide price rallies in the months ahead, potentially offering opportunities to price wheat at levels higher than currently anticipated. Producers should actively monitor market developments and be ready to market wheat when those opportunities arise. As of mid-day on May 12, the July U.S. wheat contracts were down 1.25 to 1.8%.

Terrain content is an exclusive offering of AgCountry Farm Credit Services,
American AgCredit, Farm Credit Services of America and Frontier Farm Credit.