Situation:
The realities of “higher for longer” interest rates have significantly added to the cost to carry inventory (inputs and outputs like grains). At the same time, retailers, processors and end users are also less willing to carry the inventory bill. Producers should reassess their marketing plans that may have been built on a much different cost structure.
Outlook:
Interest rates will likely remain elevated through most of 2024, which could force more leveraged producers to reduce inventory holdings but could also offer some marketplace bargains for unleveraged producers.
Interest Costs Take a Bigger Bite
The Federal Reserve has held interest rates steady since raising the federal funds rate to a target range of 5.25% to 5.5% in July 2023. Members of the Federal Open Market Committee remain steadfast in their willingness to keep interest rates “higher for longer” if necessary to curb inflation.
In the near term, the fed funds rate is likely to remain elevated, with the possibility of rate cuts later in the year should inflation soften.
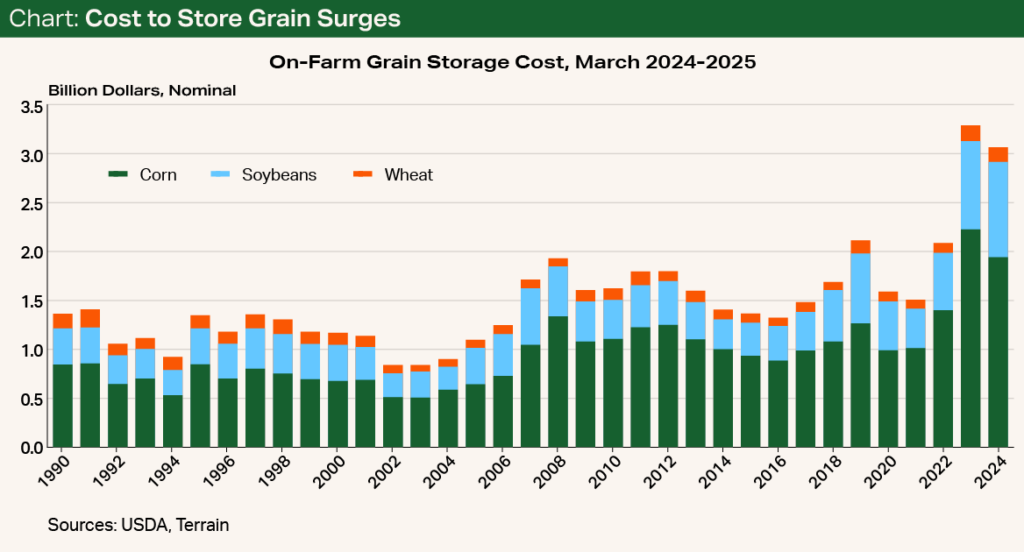
By my calculations, the cost to store the March inventory of corn, soybeans and wheat for one year would be the second highest on record.
The “higher for longer” mantra has significantly increased the cost of carrying inventory, both outputs and inputs, on operating notes.
The USDA estimates that the interest cost on capital nearly doubled per acre of planted corn in 2023 compared with 2022. Tax data from the Kansas Farm Management Association indicates total interest paid by non-irrigated crop producers increased 22% in 2023 from a year earlier and was 10% above the three-year average. I expect total interest expense in 2024 to be similar to 2023 as slightly cheaper input costs help balance elevated interest rates and loan volumes.
Elevated interest rates also come at a time when inventory levels for some commodities are at or near historic highs. For example, on-farm stocks of corn and soybeans were the second- and third-highest March levels since 1990, respectively, according to the USDA. By my calculations, the cost to store the March inventory of corn, soybeans and wheat for one year would be the second highest on record and 72% higher than the 2014 to 2023 average, using national average prices and interest rates (see Chart).

At the farm level, the carry for new-crop corn from a December 2024 contract to a July 2025 contract is about equal to the interest cost to carry the grain on a simple loan, using the Fed’s average fixed rate on operating notes. This would leave no margin for utilities, handling, drying, and other transactional costs associated with on-farm storage and marketing. (Iowa State University’s Cost of Storing Grain worksheet is an excellent resource to work through alongside your Farm Credit relationship manager.)
I expect interest rates, and the resulting cost of carrying inventory, to remain elevated through most of 2024.
In the West, almond farmers are facing a similar problem. Uncommitted almond inventory, and the cost to carry that inventory, in April was the third-highest level for the month since 2009. The large almond inventory comes on the heels of several years of declining liquidity and the possibility of a large 2024 crop, making the cost of carrying this inventory financially difficult.
Carrying Cost Considerations
I expect interest rates, and the resulting cost of carrying inventory, to remain elevated through most of 2024. I do expect that the Fed will slightly lower interest rates at some point in 2024, but not nearly quick or steep enough to help most farmers. The question then is, “Who carries the cost of inventory in 2024? If I do, how can I prepare for the cost?”
For inputs, farmers have already shown the ability to reduce their inventory levels. For example, the USDA’s Farm Sector Balance Sheet indicates that farms slightly reduced their inventory of purchased inputs in 2023. Survey results from both the Federal Reserve Bank of Kansas City and Purdue University also indicate that farmers are significantly tightening their spending.
For storing physical commodities, grain farmers have already observed a partial answer to this question as basis has widened, or become “more negative,” compared with recent averages as grain elevators look to buffer some of the interest cost.
Though basis levels at end users have declined somewhat from the elevated levels of 2022 and parts of 2023, they are still near historical averages. Still, end users are also looking to avoid large, costly inventories. For additional analysis on the impact to grain elevators, see Tanner Ehmke’s CoBank Knowledge Exchange article.
Almond producers have also felt the pain as retailers have kept in-store inventory levels low and passed the inflationary costs on to U.S. consumers. Additionally, higher interest rates, a strong U.S. dollar and increasing vessel rates combined have kept international buyers from building large inventories despite decent underlying demand. In both cases, end users are largely operating with smaller inventories and pushing the cost to carry back to the farmer.
Without proper care, the farmer may end up absorbing the full cost of carrying inventory.
Given the fight over who carries the interest costs, farmers should carefully consider in their break-even analysis their own interest costs — and opportunity cost — of carrying inputs and storing commodities. Without proper care, the farmer may end up absorbing the full cost of carrying inventory. For unleveraged producers, the market may also provide some pricing bargains as input dealers look to unload inventory to avoid paying extra to carry on their end.
Terrain content is an exclusive offering of AgCountry Farm Credit Services,
American AgCredit, Farm Credit Services of America and Frontier Farm Credit.