Report Snapshot
Situation
In the coming decades, the aging and diversifying U.S. population will be passing several milestones. There will be more older Americans than children, and the population growth will be driven more by immigration than by natural rate of increase.
Finding
As the demographic makeup of U.S. consumers changes, demand for milk fat should continue to grow, albeit not enough to completely offset the slower population growth. Demand for skim solids in the U.S., meanwhile, will flatline, relying on export markets for growth.
Impact
Demographic changes will structurally shift the demand for and values of milk fat and skim solids. Chasing this value could have genetic implications for the makeup of the U.S. dairy herd and will impact how milk is valued.
U.S. domestic consumers are high-value sources of dairy demand. Although U.S. dairy exports continue to grow and represent further opportunities for growth ahead, the domestic market is the primary outlet for dairy produced in the U.S., representing about 80% to 85% of milk volume and more than 90% of value.
U.S. domestic consumers are high-value sources of dairy demand. Although U.S. dairy exports continue to grow and represent further opportunities for growth ahead, the domestic market is the primary outlet for dairy produced in the U.S., representing about 80% to 85% of milk volume and more than 90% of value.
The U.S. population is getting older and more diverse, and that will have meaningful implications for dairy demand. The growing segment of older consumers has demonstrated some of the fastest growth in dairy demand in recent years. Still, slower overall population growth will be a headwind for domestic dairy demand to overcome.
Through the lifespan of a consumer, dairy demand may start with infant formula followed by fluid milk before diving into mac and cheese and pizza. Somewhere around middle age, that consumer may start looking at cutting back on some of the dairy-heavy staples but may still enjoy the occasional specialty cheese. Older consumers interested in maintaining health and enjoying retirement seek out healthy-aging products and nutrition shakes as well as the occasional ice cream.
As demographic makeup changes, the product mix in the U.S. will change, and with it, the demand for dairy components like milk fat and skim solids. This report investigates the implications of a changing population on dairy component demand by combining data from the National Health and Nutrition Examination Survey conducted by the Center for Disease Control; the Food Intakes Converted to Retail Commodities Database from the USDA, as well as a variety of sources to convert those foods into dairy components; and population and demographic projections from the U.S. Census Bureau.
A Changing U.S. Population
According to the U.S. Census Bureau, the U.S. population is headed for several demographic turning points in the coming decades.1
- 2030 will mark when all Baby Boomers will be older than 65 years.
- Four years later, older adults (over 65 years) are projected to outnumber children for the first time in history.
- By 2060, the population over 65 years old will nearly double, and the population over 85 years old will nearly triple.
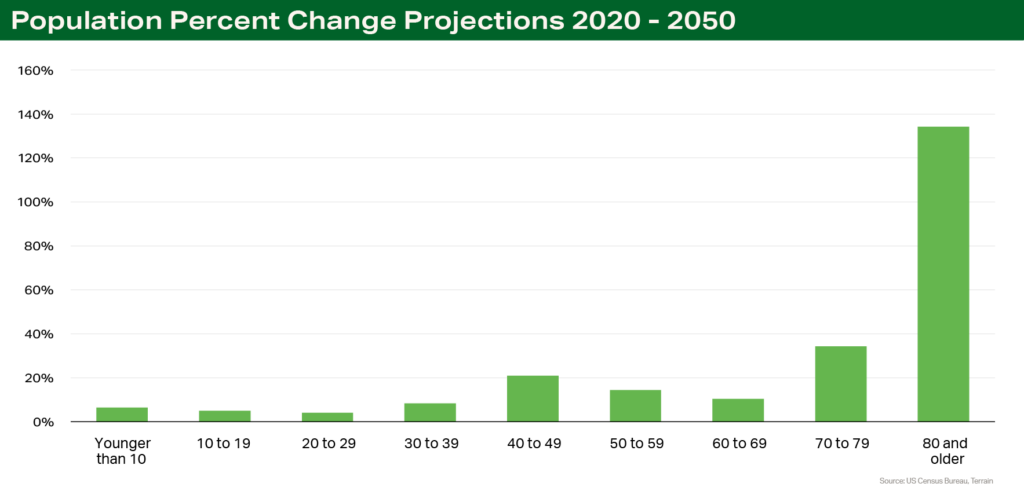
As the older population overtakes the younger population, deaths begin to outpace births and the natural rate of population change (births minus deaths) falls. Immigration will disproportionately be the driver of population increase in the decades ahead.
The combined effect will be slower growth of about 1.8 million more people per year through 2050 compared to an average of about 2.3 million per year since 2010. The resulting population will be older and more ethnically diverse.
Dairy Consumption Patterns
Breaking down current demand patterns of U.S. consumers by demographic groups helps shed light on what might happen as those demographic groups increase and decrease in influence.
Pizza is an important source of dairy consumption in the U.S. Nearly 25% of cheese consumed in the U.S. is in the form of pizza. On any given day, about 1 in 8 Americans consume pizza. However, those pizza consumers aren’t distributed evenly across age groups. The strongest demographic for pizza demand is 6- to 19-year-old males, of whom about 1 in 4 consume pizza on a given day. Of adults over 60 years old, meanwhile, only 5% to 6% consume pizza on a given day.2 An aging population, therefore, may not be a favorable scenario for pizza demand.
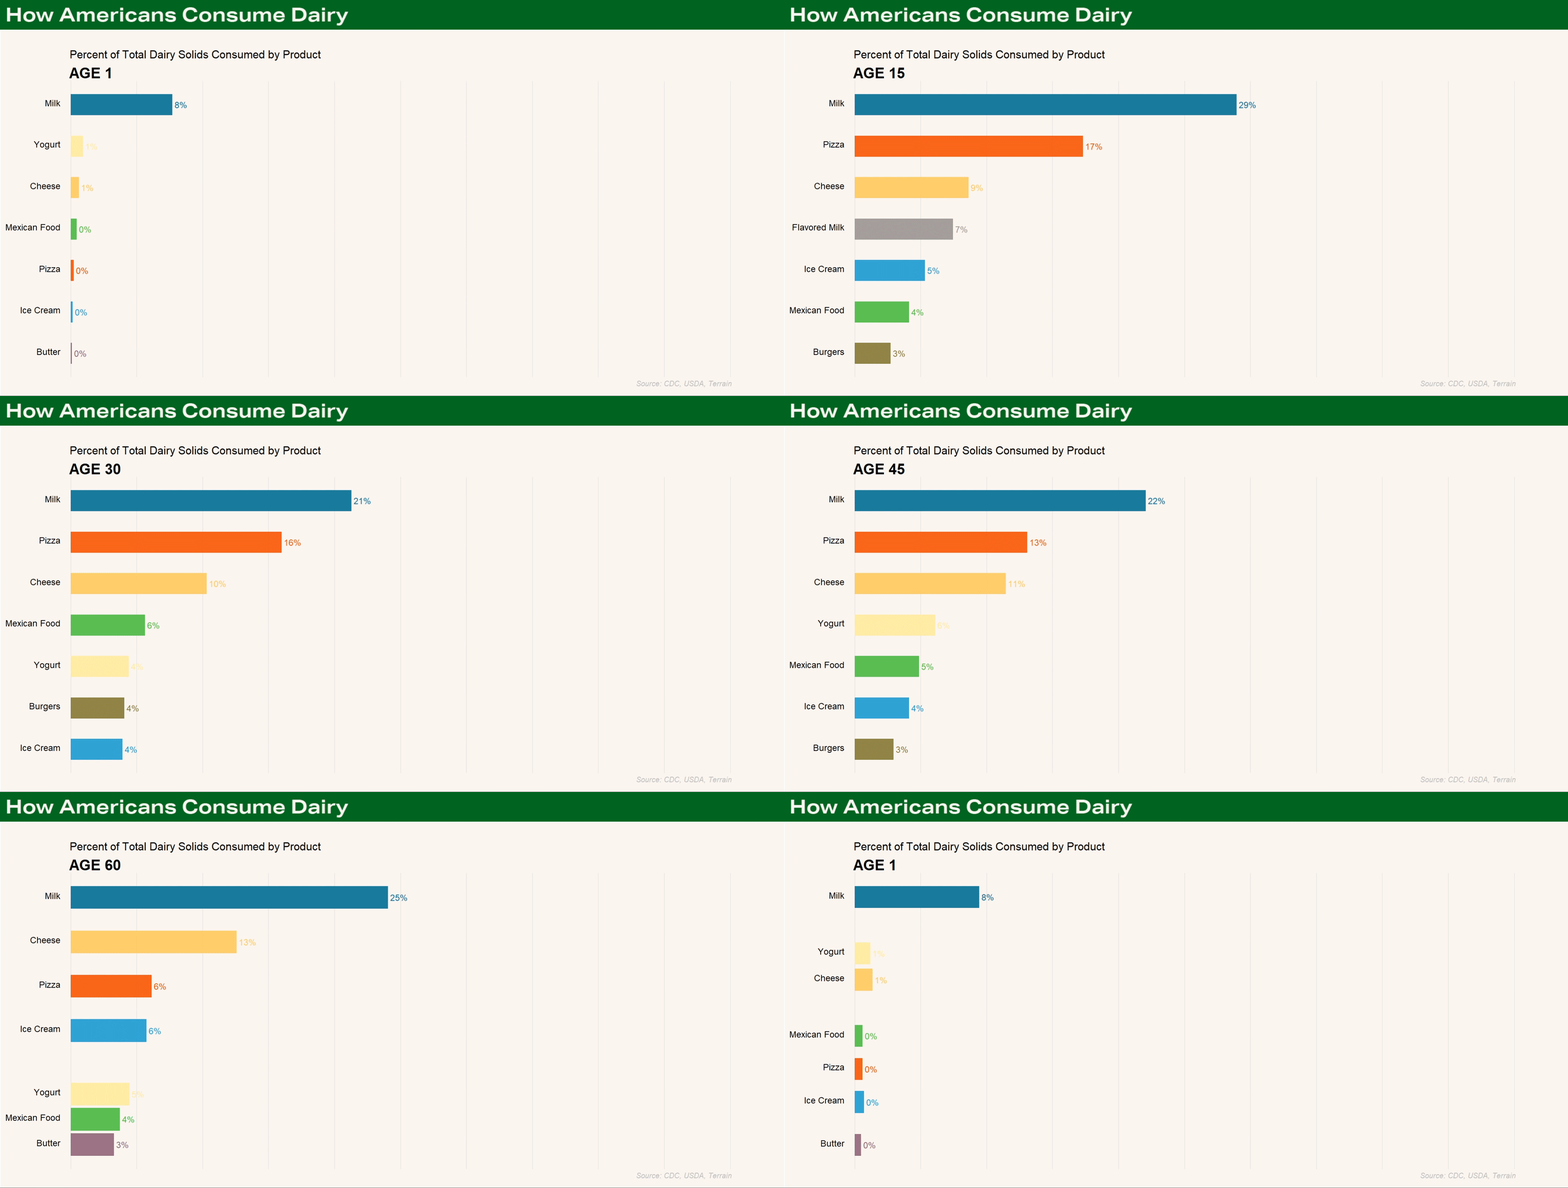
After getting the majority of their milk fat in the form of whole milk in early childhood, cheese (whether on pizza or otherwise) is the main driver of milk fat consumption for Americans. Skim solids are primarily consumed in the form of fluid milk for males and cheese for females. Increasingly, as fluid milk consumption continues its gradual decline and cheese consumption grows, cheese is becoming the dominant form of delivery for all milk solids to American consumers.3
Fluid milk consumption patterns highlight some of the implications of immigration as a demand driver. In general, recent immigrants are more likely to drink fluid milk than their U.S.-born counterparts. The highest probability of milk consumption is observed among Hispanic immigrants. While this might be a silver lining for fluid milk demand, the impact could be muted by the fact that the higher consumption rates tend to converge toward more typical American levels after five years in the U.S.4
Among consumers over 70 years old, fluid milk and ice cream have been strong primary sources of dairy demand. However, a continuation of that trend is not guaranteed.
Ice cream may maintain strength among older Americans, but will fluid milk maintain popularity among the older demographic when those consumers are coming from generations that had experienced declining interest in fluid milk? If not, might they consume more pizza than the septuagenarians of the past? Time will tell, but demand from this growing demographic will likely look different than it has in the past, and marketers will need to adjust accordingly.
What does this mean for dairy component demand?
Combining the projected growth in population age groups with the trends in dairy consumption for each of those groups can give us some expectations of where we are likely to see developments in domestic demand in the coming decades.
To simplify the huge variety of dairy products measured in the dietary surveys (from cheese on a pizza, to butter in scrambled eggs and lactose in infant formula), I converted each food reported in the survey data used into an equivalent amount of milk fat and skim solids. This allows us to view the demand shifts in terms of milk components that can be influenced at the farm level.
Older consumers have increased their milk fat consumption dramatically in recent years. While this isn’t enough to overcome the projected overall slower growth in population, it is a positive story for fat values relative to skim values.
Combining the projected growth in population age groups with the trends in dairy consumption for each of those groups can give us some expectations of where we are likely to see developments in domestic demand in the coming decades.
Skim solids demand growth, meanwhile, is projected to be only 0.1% annually. This is a significant flattening from the historical growth trend of 1.6% annually since 2000.
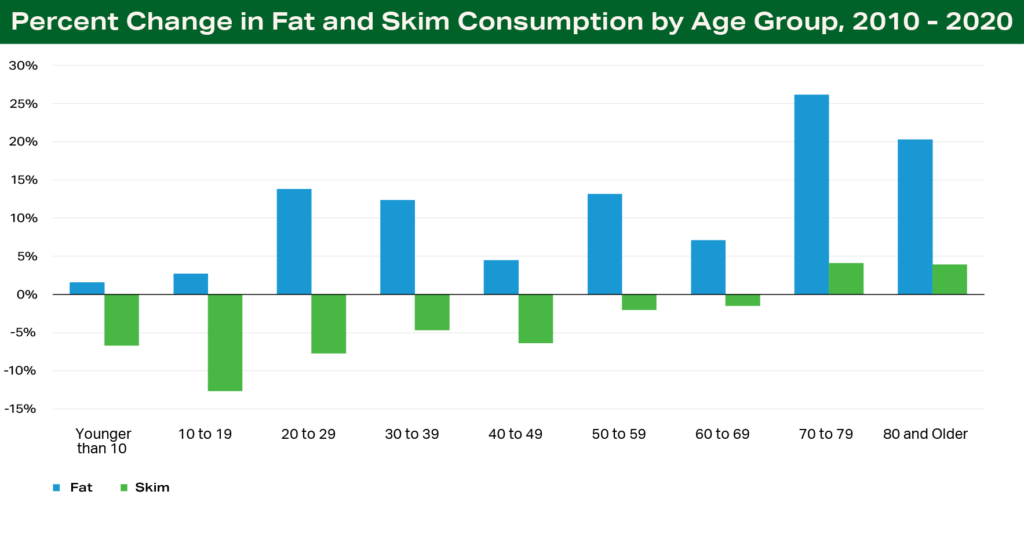
I project fat consumption per capita to increase across nearly all age and gender groups except for females younger than 10 years old, which may see a very slight decline. The strongest growth is expected to occur in the older age groups for both genders, though particularly strongly for males. The historical data the projections are based on, between 2010 and 2020, includes a period of changing attitudes toward the health of butter and other dairy fats. This change influenced the strong growth in demand. Many of these projections were adjusted to more conservative and realistic levels assuming the same rate of growth is unlikely to be maintained over multiple decades.
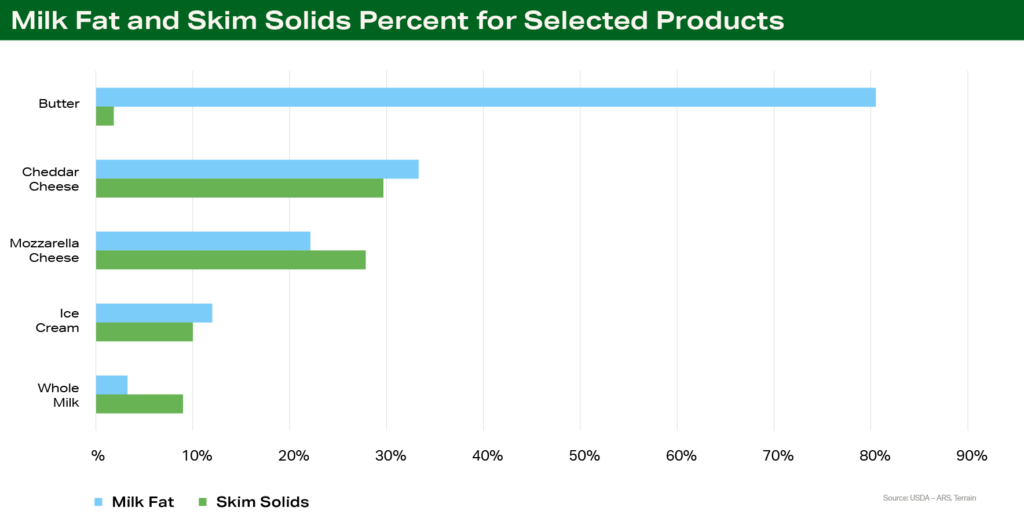
I project skim solids consumption to continue to decline across age groups younger than 30 years old for both males and females. For age groups 30 years old and older, growth trends are mixed and less dramatic. But, like fat demand, Americans 70 years and older will drive the growth in per capita demand for skim solids. Some of this growth will be driven by products targeted at healthy aging, but some may be a result of higher dairy intake in general as concerns about dairy fat subside.
What adjustments at the farm are needed to meet the changing demand?
Farm milk makeup in the U.S. varies by region and through seasons, but it has evolved over time to match the demands of consumers. Will it be able to keep up going forward?
The Federal Milk Marketing Order system in the United States has the job of transmitting value from finished dairy products upstream to the farm. Federal order formulas take, as inputs, the wholesale prices of dairy products (cheese, butter, nonfat dry milk and whey) and determine the corresponding value of the components in farm milk to make those products.
Over time we can see these forces at work. When consumers demand more butter and cheese, the value of fat in farm milk goes up, and dairy producers, through a combination of feed and genetics, start producing milk with higher fat content.
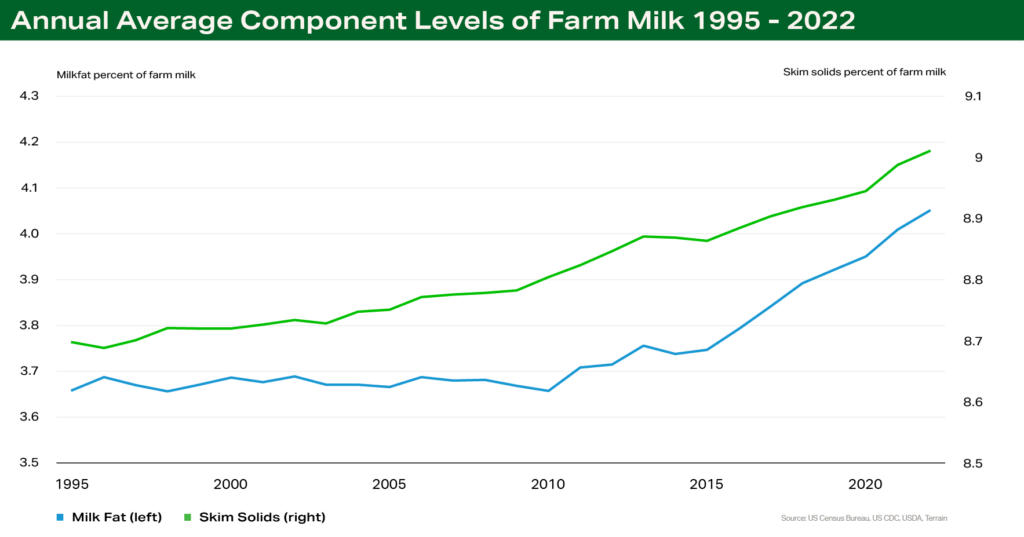
The fat content of U.S. farm milk averaged between about 3.6% and 3.7% through 2010. In 2010 fat content began to climb, chasing higher value driven by strong butter and cheese markets. Since then, fat tests of farm milk rose from 3.65% in 2010 to 4.01% in 2021. And the fat content of farm milk has continued its upward trajectory into 2022 as butter prices soared to record highs.
The skim solids content of farm milk has climbed more gradually from 8.7% to 9% since 1995, an annual growth rate of 0.13%. Historically fluid milk was the primary outlet for domestic skim solids. While skim solids demand has benefitted from growing exports of products like whey and nonfat dry milk as well as cheese demand, its growth has been muted somewhat by declining fluid milk demand.
If we continue the current trajectory of increasing component levels and increasing output of milk per cow, we will easily meet future domestic consumption levels. And we will do so without adding additional cows to the U.S. herd.
With steady cow numbers at 9.3 million head (about the average level over the past 30 years) and continued component increases following the trend of the past 25 years, U.S. production of skim solids will be 10.7 billion pounds greater per year, and milk fat will be 5.7 billion pounds greater in 2050 than in 2020.
Meanwhile, the population growth and demand projections will drive additional annual consumption of 2 billion pounds of dairy fat in 2050 compared to 2020, and a negligible increase of only 280 million pounds of skim solids consumption.
A factor worthy to note is how food waste will contribute to demand trends. The projections in this report focus on changes in consumption, what consumers are actually eating, but any increase in consumption inherently comes with an increase in waste along the way. The USDA ERS estimated in 2010 that approximately 30% of food in the U.S. was wasted at the retail and consumer levels. Factoring in waste could result in even tighter fat supplies but still likely too much skim.
Of course, domestic demand is only part of the story. Populations in the rest of the world are changing as well, and in many cases growing at faster rates than in the U.S.
Can the Export Market Absorb the Additional Skim Solids?
Skim solids content makes up more than 90% of total exported milk solids, so increasing exports is the clearest path to relieving the future market of extra skim. But the projected overhang of skim solids could still weigh on markets.
The U.S. will have opportunities to gain market share in the global export market. The EU and Oceania face firm environmental constraints, which will limit their production growth. As the U.S. market share grows, so too will populations in export destination markets. Similar demographic shifts will drive export demand in nuanced ways that are important but outside the scope of this report.
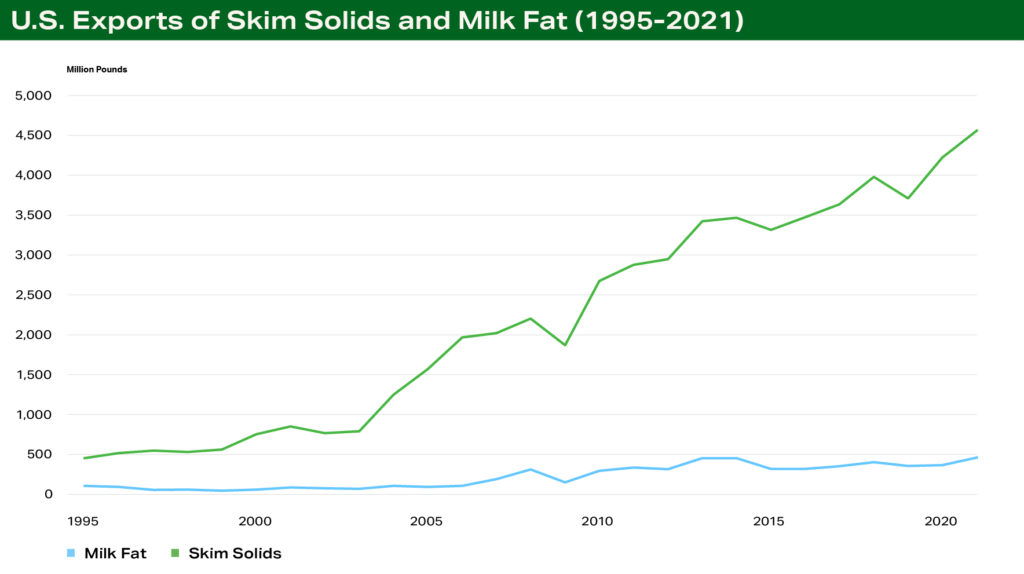
Looking to historical trends, skim solids exports have increased substantially from 453 million pounds in 1995 to 4.2 billion pounds in 2020, an average growth rate of 9.3% annually. Much of the increase over that period can be attributed to strong growth in demand from China for whey and milk powders, which could see slower growth in the decades to come. Maintaining a similar growth rate ahead will likely rely on other regions to step in with additional demand growth. While it may be a generous assumption, if we project a continuation of that trend forward, skim export demand would climb to 9.4 billion pounds by 2050. This represents 5.1 billion pounds of additional demand in 2050 compared to 2020, falling short of the nearly 11 billion excess pounds that would not be absorbed by the flat growth in the domestic market.
The resulting excess supply of skim solids will weigh on the component values of protein and other solids, but it could help position the U.S. as a supplier of affordable dairy protein to growing populations in new markets. This could help clear the market of the excess solids, but increasing exports of milk fat, in the form of cheese or otherwise to existing markets would bring a more rapid infusion of value.
Conclusions and other factors
There is plenty of time for unforeseen changes and other dynamics to impact these long-term projections, but the direction of supply and demand trends and the impact that a changing U.S. population will have on demand provides a starting point to prepare for the future.
Supply and demand will balance over time, and prices will be the mechanism through which that happens.
The projections suggest that continued elevated fat values, relative to skim values, will incentivize milk fat production over skim solids.
If genetic progress and efficiency in per-cow milk production maintain their current paths, we will be able to meet and exceed the demand for components without adding additional cows to the U.S. herd. This has positive sustainability implications and means that expansion will likely be driven by consolidation and efficiency as opposed to herd size growth. Decades-long trends don’t speak to short-term volatility, and there will still be plenty of month-to-month volatility driven by near-term demand factors and weather. But longer term trends toward greater milk fat demand are worth considering for herd genetics and long-term marketing plans.
1Vespa, Jonathan, Lauren Medina and David M. Armstrong, “Demographic Turning Points for the United States: Population Projections for 2020 to 2060,” Current Population Reports, P24-1144, U.S. Census Bureau, Washington, DC, 2020.
2Rhodes DG, Adler ME, Clemens JC, LaComb RP, Moshfegh AJ. “Consumption of Pizza: What We Eat in America, NHANES 2007-2010.” Food Surveys Research Group Dietary Data Brief No. 11. February 2014.
3Teran, Angel and Cessna, Jerry “Farm Milk Components and Their Use Among Dairy Products Have Shifted Over Time.” Amber Waves, USDA Economic Research Service, August, 2021.
4Gustavsen GW, Dong D, Nayga Jr RM, Rickersten K, “Ethnic Variation in Immigrants’ Diets and Food Acculturation – United States 1999 – 2012.” Agricultural and Resource Economics Review 50, 43-62, 2021.
Terrain content is an exclusive offering of AgCountry Farm Credit Services,
American AgCredit, Farm Credit Services of America and Frontier Farm Credit.