The Big Shrink • July 23, 2026
Counting Calories for Long-Term U.S. Export Potential


Report Snapshot
Situation
As the conversation intensifies around the global population peaking, questions arise as to whether increasing caloric intake could offset population decline.
Finding
The trend of increasing caloric consumption, in most countries, will not fully offset the future decline in the global population and the reality of slower demand for U.S. agriculture exports in the future.
Outlook
Most of the current top U.S. trading partners will hit peak caloric consumption in the next 30 years.
Impact
The U.S. will need to forge new trade partnerships and continue to develop high-value products and markets.
As the rate of global population growth begins to slow, and eventually halts altogether, U.S. agriculture will see a paradigm shift. One important question that arises is whether an increase in per capita food consumption can offset a decline in the world population.
My analysis finds that increasing food consumption can offset population decline for only a short period of time. Over the long term, many top importers of U.S. agricultural goods are likely to reach a maximum caloric intake. As a result, the U.S. will need to continue to find new export partners and continue to develop high-value markets and products.
How Much Does the World Eat?
The basis for the assumption that the world will eat our way out of a population change is based on two arguments:
- There is a large food gap between the U.S. and other countries
- Other countries are on a path of increasing food consumption
It is true that the food supply in the U.S. outstrips most other countries. The data for food consumption across the globe is limited. For the purposes of this report, I use food available for consumption, as calculated by the Food and Agriculture Organization of the United Nations (FAO), as a proxy for total consumption. This variable tabulates the total amount of calories available for human consumption, net domestic food production, and imports minus exports, in each country.
By this proxy, the U.S. is in the top echelon of consumption per capita. Among the top agricultural export partners for the U.S., only Belgium outranks the U.S. for consumption per capita. The average difference in daily consumption per capita of the top 40 U.S. export partners and the U.S. is 750 calories. To put 750 calories into perspective, that is equivalent to about 1.4 McDonald’s Quarter Pounders with Cheese.
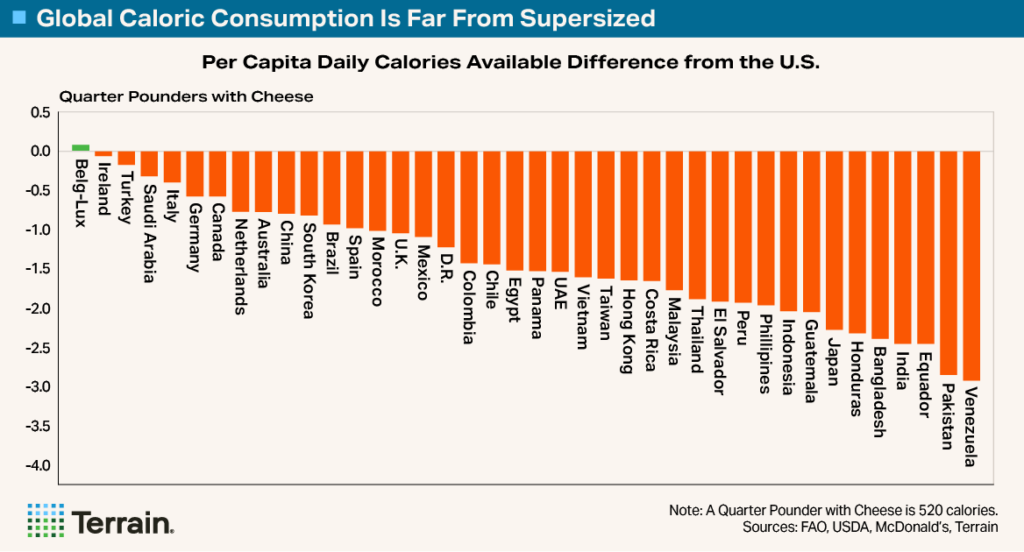
Speaking to the second argument about future food demand, most export partners are indeed on a path to increasing food availability (our proxy for consumption).
Of the top 75 agricultural export partners, only eight have a declining consumption trend line since 1990, and an additional 10 have flat to no growth.1 These 18 countries combined represent only 18% of total U.S. agricultural exports. On the other side of the coin, more than 80% of U.S. exports are going to countries with an increasing consumption trend line, a strong positive for U.S. agricultural export potential.
How Will Increased Consumption Interact With Smaller Populations?
To establish whether increased consumption can offset a slower, and eventually declining, population trend, we assume the following:
- Countries will continue the upward linear trend line of their consumption path from 1990 through 2022. However, we assume that they will never have less than the maximum that was achieved from 2020 through 2022. Therefore, even countries with a flat or declining trend line will never have less than their recent maximum, and countries that are currently above the trend line will remain flat until the trend line catches up. This method provides the most favorable scenario to the argument that we can eat our way out of a coming population shift. Given historical trends, aging populations, GLP-1s, and other current health trends, this is a very optimistic view of consumption.
- The population of each country will grow at the U.N.’s low estimate. This aligns with the findings we have made in the rest of our research in “The Big Shrink.”
- We combine the population and consumption per capita estimates until the year 2100. The combined sum of total food available creates a proxy for the total addressable market of calories that the U.S. can sell into.
The combination of increasing consumption does, to a certain extent, offset slower-to-declining population trends. For example, the U.N.’s low estimate for global population peak is 2060. However, when assuming an increasing trend in per capita consumption, the total addressable food market does not peak until 2068. Likewise, total caloric intake for China does not peak until 2037 even though its population has already peaked.
The broader canvas still paints a picture of an eventual peak in total addressable markets, despite the slight offset from an assumed increase in calories available. For example, China’s total caloric consumption still peaks in 2037, and the top 15 partners excluding China peak in 2054 — these 15 countries represent 75% of U.S. exports. Moreover, the top 31-45 partners peak in 2059, and the top 16-30 partners peak in 2065.
The bright spot is trade partners that are currently much smaller (top 46-75 partners), are not expected to peak until 2095. Today this group only represents about 4% of U.S. exports but over time could represent a much larger share, with a combination of growth and market development.
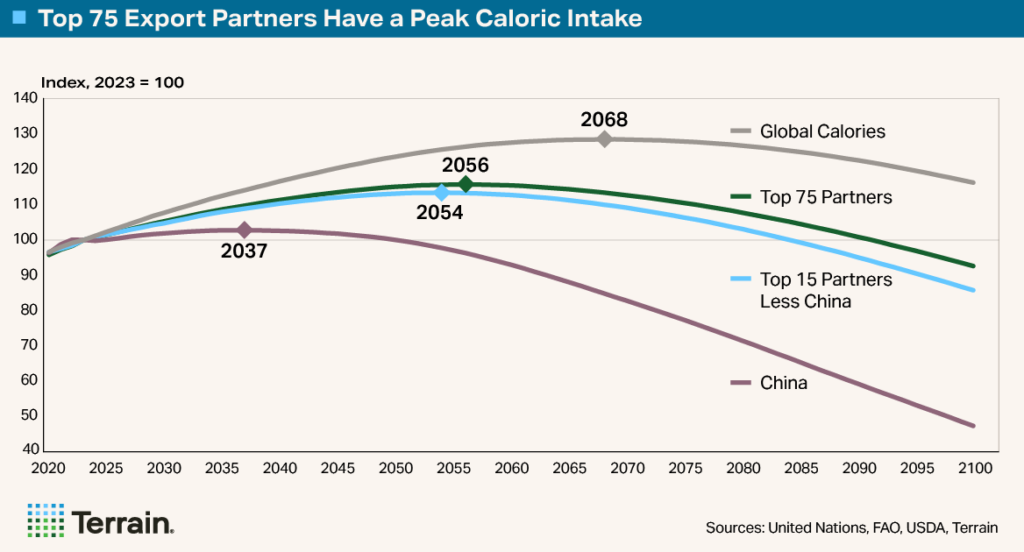
For U.S. agricultural exports, the peak amount of total food available is perhaps more important than the date itself. In this calculation of the total addressable market, population size matters. A country that has high consumption per capita but a low population has a smaller total addressable market.
For example, in 2037 China will command 24% and India will command about 19% of total calories available of the current top 75 trade partners. However, by 2056 when India peaks, the two will be nearly equal. Notably, for bulk production, finding a counterweight to these two countries both in sheer population size and calories available per capita will be a challenge for the agricultural industry.
As a potential canary in the coal mine, our analysis indicates that 13 of the current top 75 trade partners have already peaked in their total calories available.2 Total U.S. exports to these countries grew at a nominal compounded annual growth rate of 1.7% from 2000 to 2025. Comparatively, exports to the other 62 countries grew at a rate of 5.5%. When factoring in inflation, exports to the 13 countries that have peaked in total calories available have declined in value and now make up about 15% of the export mix, down from a high of 37% in 1993.
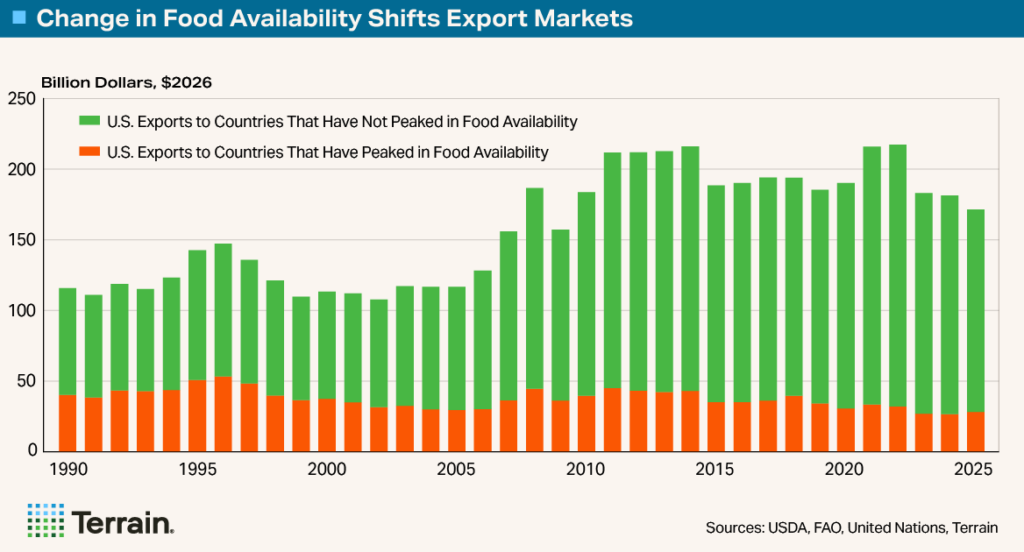
Our analysis finds that in the short term, increasing consumption can offset some population decline, but in the long run, population decline outweighs a constant increase in consumption. In the very near future, these impacts are unlikely to be felt in the aggregate, but the industry has already seen the long-term impact of shifting partner primacy as some partners have reduced their total caloric needs.
There is not a never-ending increase in the total addressable market, as measured by total caloric intake, for U.S. agricultural exports.
What Does This Mean for U.S. Agriculture?
In the short term, U.S. agriculture is likely to continue along the current path. The majority of the export partners will continue to grow their total available food needs, and the U.S. should be modestly well positioned to continue to sell into those markets. The U.S. agricultural trade industry should work to continue to develop new export markets in high-growth areas to push the future date of peak calories further into the future. Returns on this type of market development are unlikely to materialize in early stages but could pay large dividends in future years as many current trade partners begin to decrease their calorie needs.
In the long term, this analysis furthers a broader point of “The Big Shrink”: There is not a never-ending increase in the total addressable market, as measured by total caloric intake, for U.S. agricultural exports. There will be an eventual paradigm shift in agricultural production. The shifts that seem mostly likely are:
- An increased importance of protein and similarly nutrient-dense products. It is likely that “products” will slowly take the narrative from “commodities,” which may increase the share of domestically processed commodities. Terrain’s economist Ben Laine detailed how dairy could benefit from these shifts.
- A decreased importance of bulk commodity shipments that meet the minimum specifications. The market for these products will likely continue to drive toward the lowest-cost producer on a global scale, and commodity prices are likely to remain volatile only during sharp production issues. The U.S. industry will need to be more mindful of its comparative cost advantages to other exporting countries by means of transportation costs, middlemen margins and trade agreements.
- An increasing complexity of export markets and policy to meet the bifurcated needs of more “products” and fewer bulk commodities.
- A much stronger focus on growing domestic consumption of U.S. goods, including agriculture feedstock-based renewable energy, and tailored approaches to growing demand for U.S. goods in high-growth-potential countries.
The U.S. is well positioned to take advantage of this paradigm shift even though the transition at times may feel bumpy.
Agriculture has long had paradigm shifts as markets have shifted. Our research indicates that another paradigm shift is underway on a global scale that will force U.S. agriculture to think differently.
Importantly, paradigm shifts always lead to opportunity through innovation. The U.S. is well positioned to take advantage of this paradigm shift even though the transition at times may feel bumpy.
Endnotes
1 The eight partners are Japan, Taiwan, Hong Kong, Saudi Arabia, France, New Zealand, Portugal and Bermuda; the 10 partners are the U.K., Germany, Spain, Italy, the UAE, Venezuela, Nigeria, South Africa, Kuwait and Yemen.
2 The 13 partners are Japan, Taiwan, Indonesia, Spain, Italy, Hong Kong, Venezuela, Jamaica, Poland, Portugal, Barbados, Bermuda and Russia.



Terrain content is an exclusive offering of AgCountry Farm Credit Services, American AgCredit,
Capital Farm Credit, Farm Credit Services of America and Frontier Farm Credit.